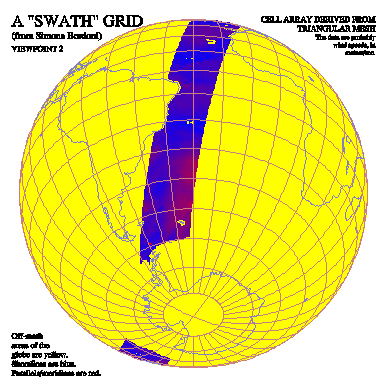
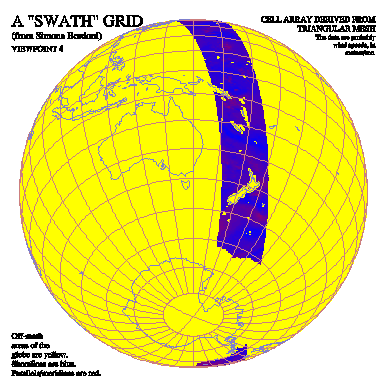
The example "ctswth" produces sixteen frames illustrating the use of
CONPACKT to draw contours on a triangular mesh that is created from a
rectangular mesh that came from Simona Bordoni. The data seem to be wind
speeds along a satellite track. Four different types of plots are shown for
each of four different views of the globe. The first type of plot shows the
derived triangular mesh, as wrapped around the globe:

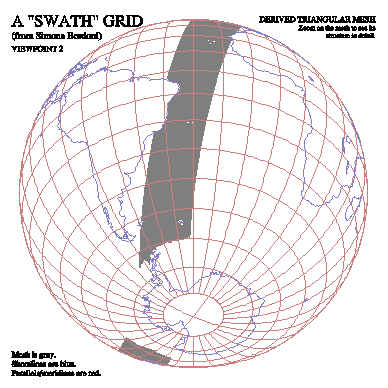

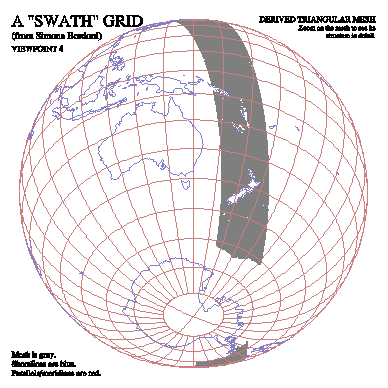
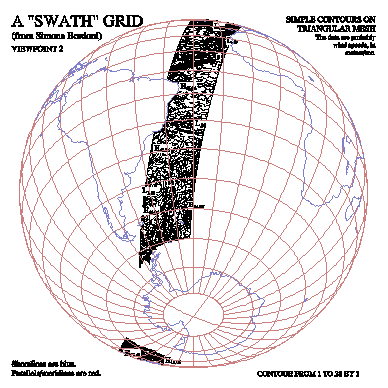
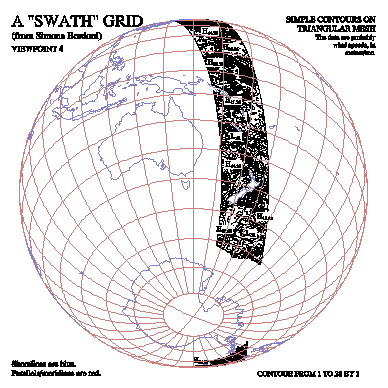
The second type of plot shows simple contours drawn by CONPACKT from the
triangular mesh:


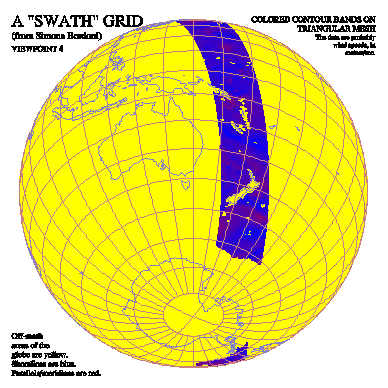
The third type of plot shows colored contour bands drawn by CONPACKT from the
triangular mesh by using CTCLAM to put the contour lines in an area map:


The fourth type of plot shows colored contour bands drawn by CONPACKT from the
triangular mesh by using CTCICA to put color indices in a cell array:

