The example "ctnccl" produces four frames illustrating the use of
CONPACKT to draw contours on a triangular mesh that is used to model the
North Carolina coastal waters and came to us from Brett Estrade. The data
are ocean depths and came from the Naval Research Laboratory at the Stennis
Space Center. For more information about the grid, see the article
"Application of a Shelf-Scale Model to Wave-Induced Circulation: Rip
Currents" (Mark Cobb and Cheryl Ann Blain, Ocean Dynamics and Prediction
Branch).
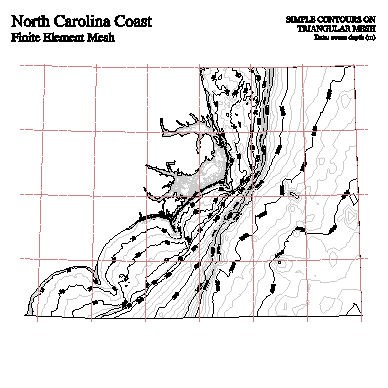
The first plot shows the triangular mesh itself, the second shows simple
contours on the triangular mesh, the third shows colored contour bands drawn
by CONPACKT on the triangular mesh by using CTCLAM to put the contour lines
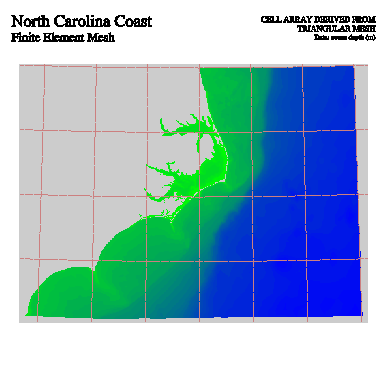
in an area map, and the fourth shows colored contour bands drawn by CONPACKT
on the triangular mesh by using CTCICA to put color indices in a cell array:


