Home |
What is NCARG |
Getting started |
Examples |
Documentation |
Download |
Support |
What's new |
Search
What's new in NCAR Graphics
This page describes new features in NCAR Graphics versions 4.4.x and
4.3.x that were added since version 4.2.0 was released in August 2000.
What's new in version 5.1.0 (released March 2009)
Some new map databases were added:
- It has about 10 times as much detail and is much more accurate.
- Its coastlines are simplified versions of those in the RANGS
database and its political outlines match what one finds on a web site
such as Wikimapia.
- It has state/province outlines for Australia, Brazil, China, and
India.
- The ice shelves of Antarctica are included.
To access these new features at the NCAR Graphics level, see
the EZMAPB
documentation.
To access these features from NCL, see examples 16 through 19 on
the "Map
only" applications page.
What's new in version 5.0.0 (released November 2007)
There are no major new features in NCAR Graphics with this release.
It is now being combined with NCL and hence given a new numbering
scheme.
To download these newly combined packages, go to the NCL download page.
What's new in version 4.4.2 (released June 2007)
What's new in version 4.4.1
- The main change to this version was to fix a problem with one of
the Fortran files so that it would compile on a system using the Intel
Fortran compiler.
- Added a new Wmap
control parameter called "BLW" allowing for the
specification of wind barb line widths.
- Added the ability in Ezmap to generate a rotated
Mercator projection.
- Added an error return in the Natgrid
package in the case that someone terminates single-point mode without
ever having entered single-point mode.
What's new in version 4.4.0
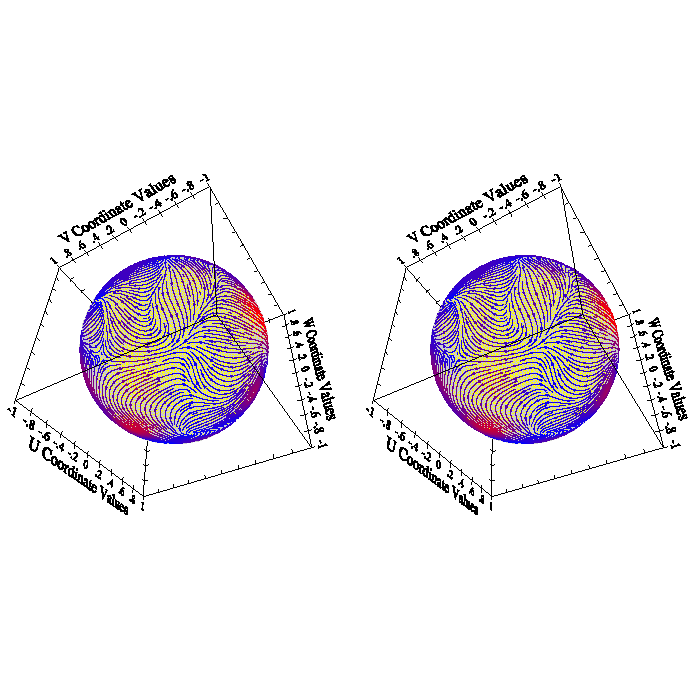
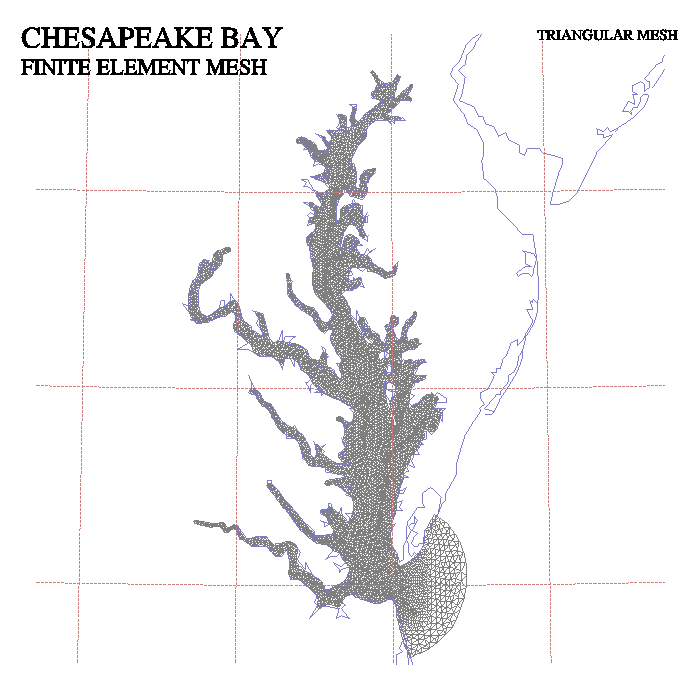
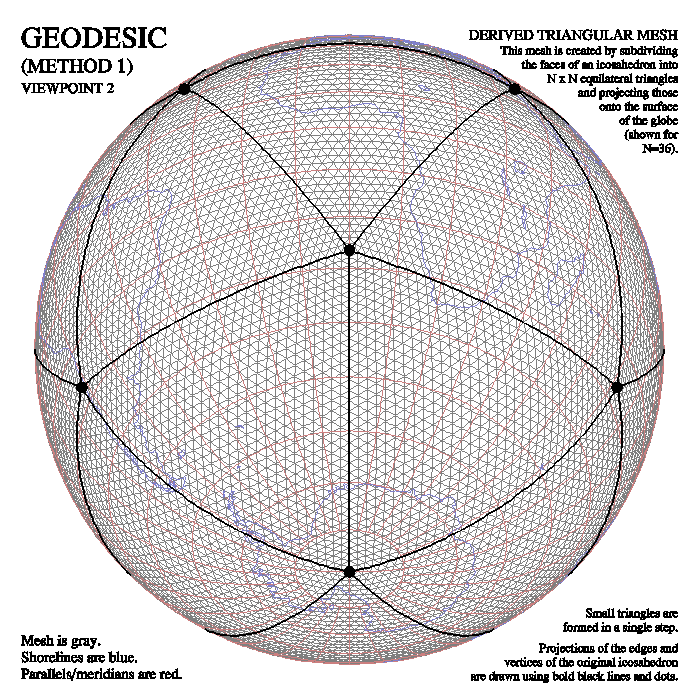
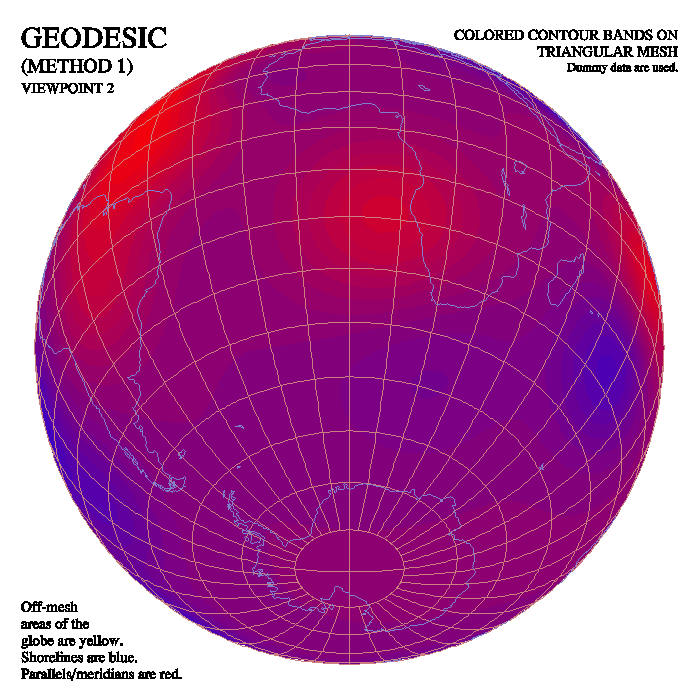
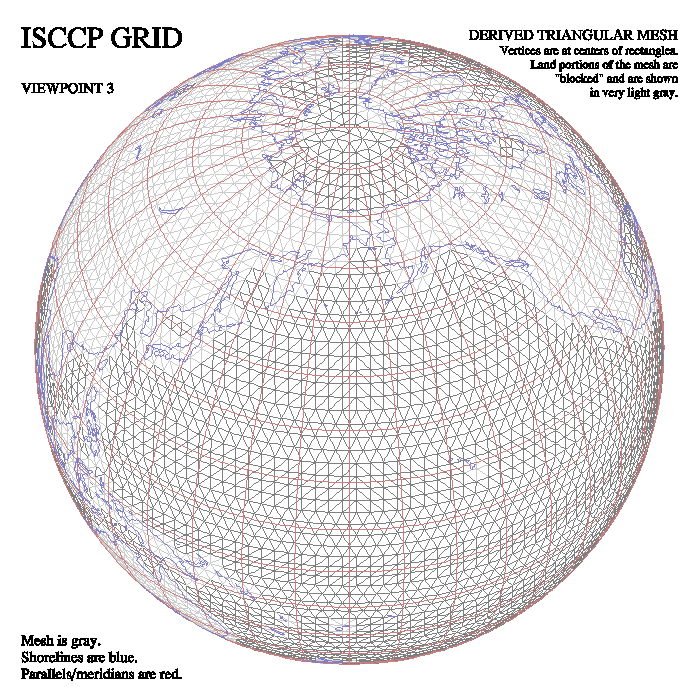
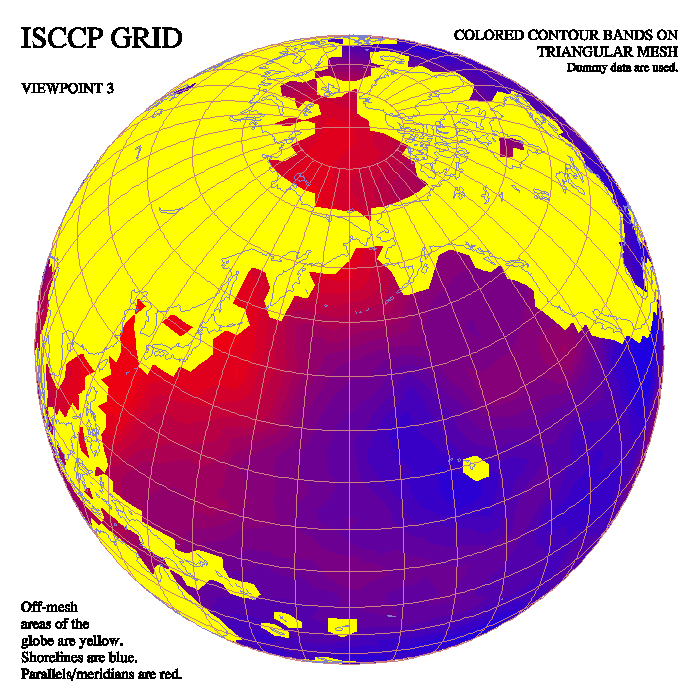
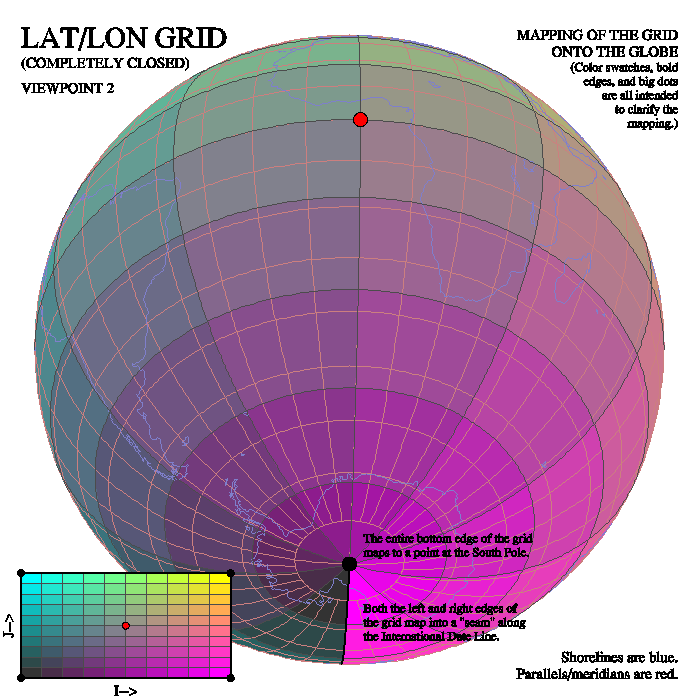
New contouring package for contouring non-uniform grids (CONPACKT)
In recent years, many new non-uniform grids
have become popular and these are being processed by new algorithms to
reduce them to triangle meshes and to contour directly on these
triangles, rather than interpolating to a uniform grid and contouring.
CONPACKT allows a user to construct these contour plots from data on
triangular meshes and provides a sort of tool kit of Fortran
subroutines that can be called in various combinations to draw
different kinds of contour plots.
| CONPACKT examples
|
| ctcbay (finite
element mesh)
| ctgeo1 (geodesic)
| ctnccl (triangular mesh)
|
| 
| 
| 
| 
| 
|
| ctiscp (ISCCP grid)
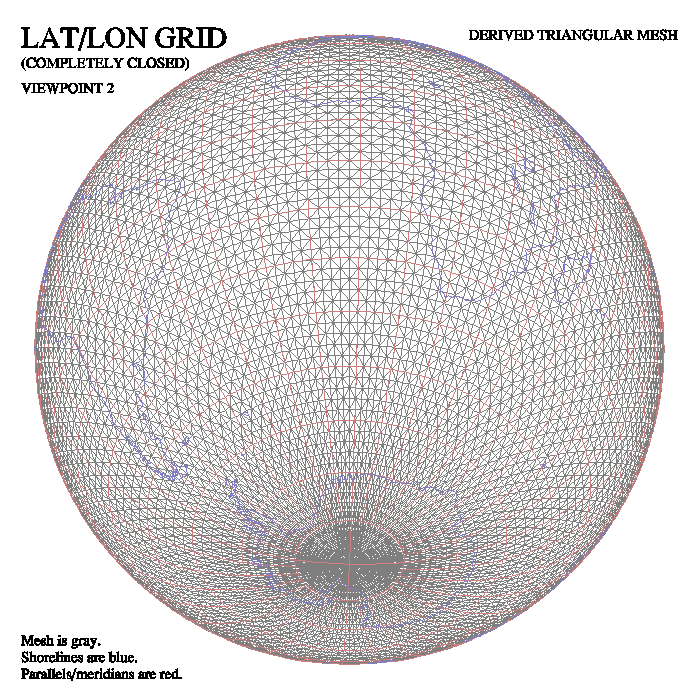
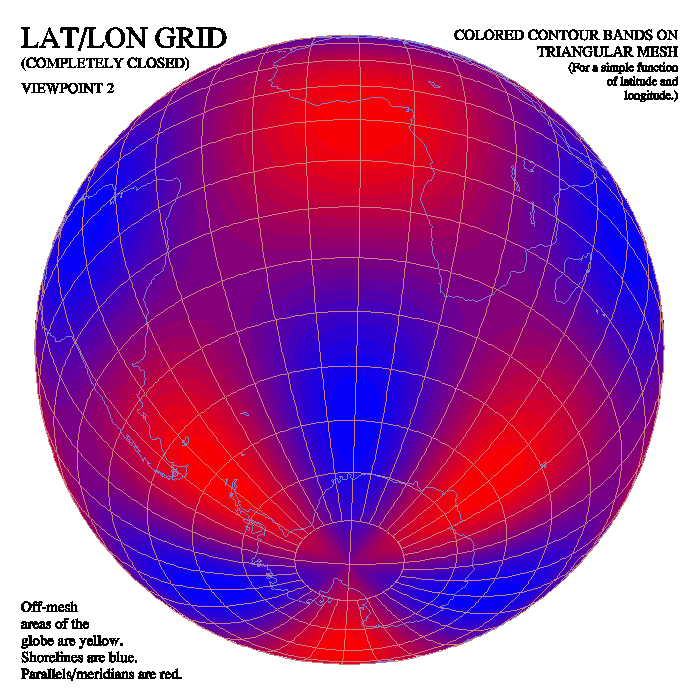
| ctllg3 (lat/lon grid)
|
|
| 
| 
| 
| 
| 
|
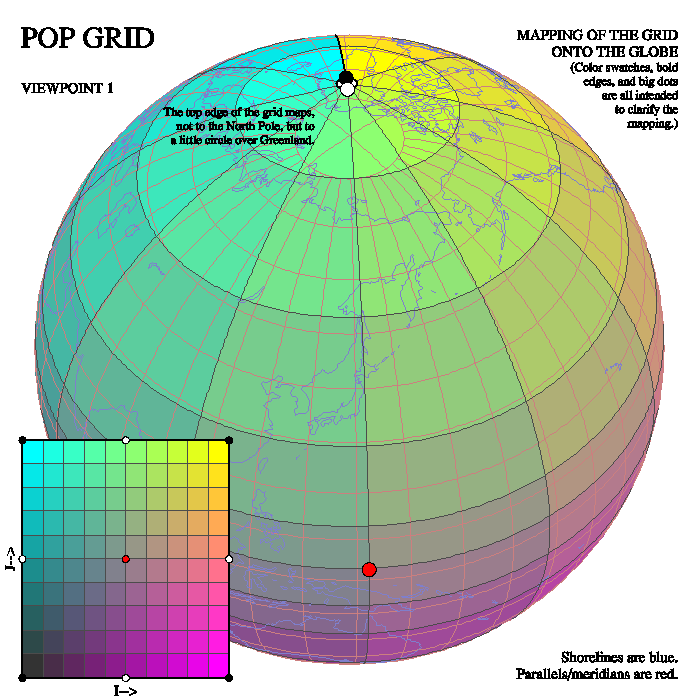
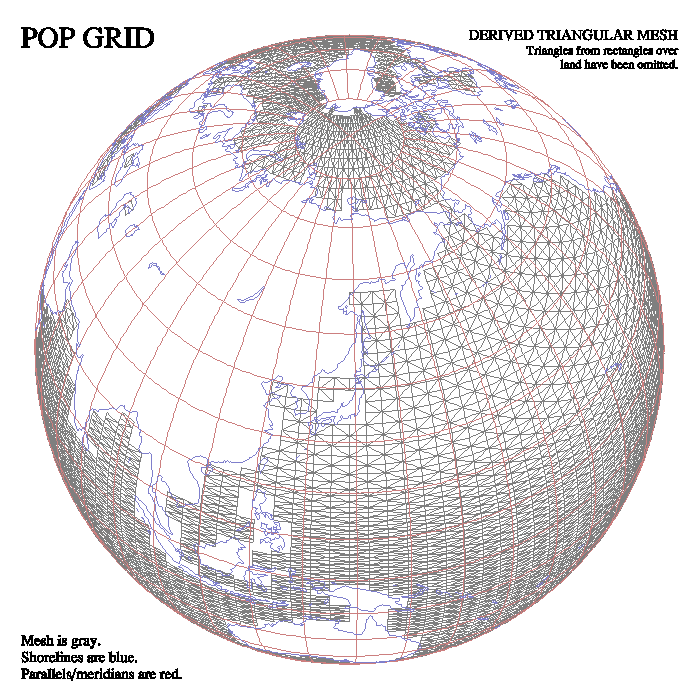
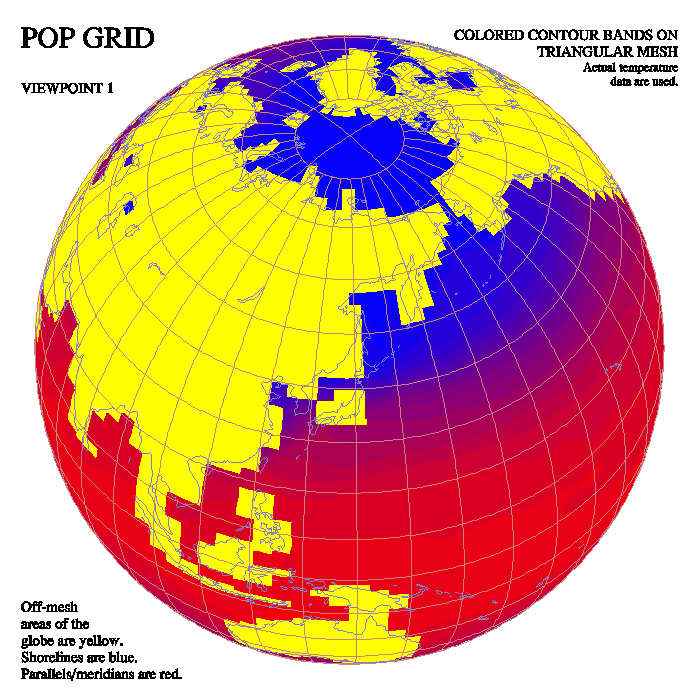
| ctpopg (POP grid)
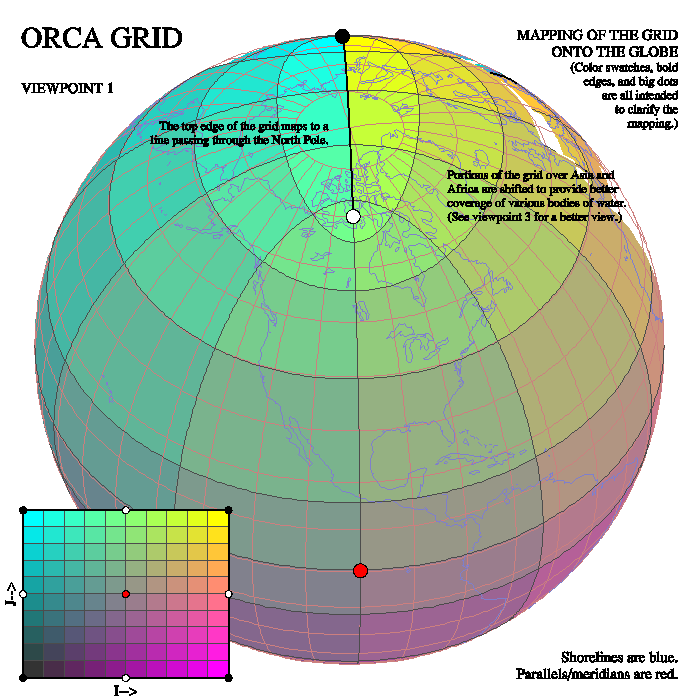
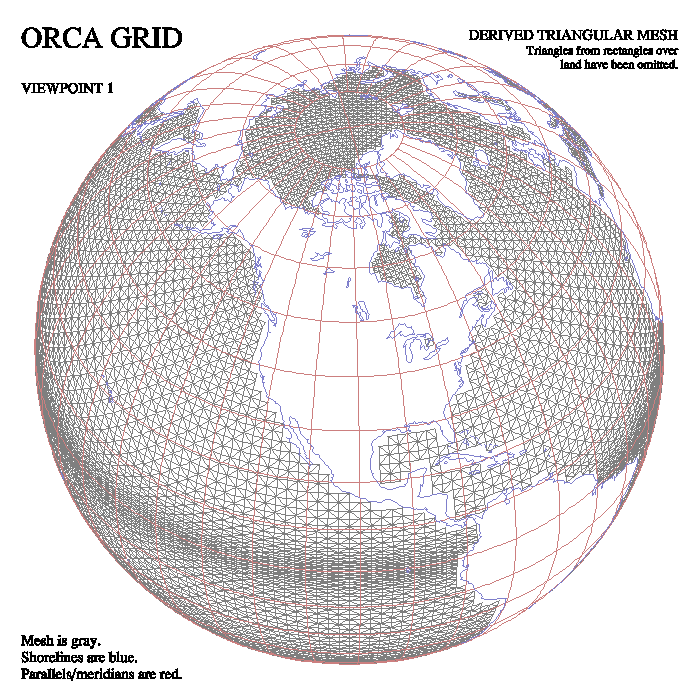
| ctorca (ORCA grid)
|
| 
| 
| 
| 
| 
|
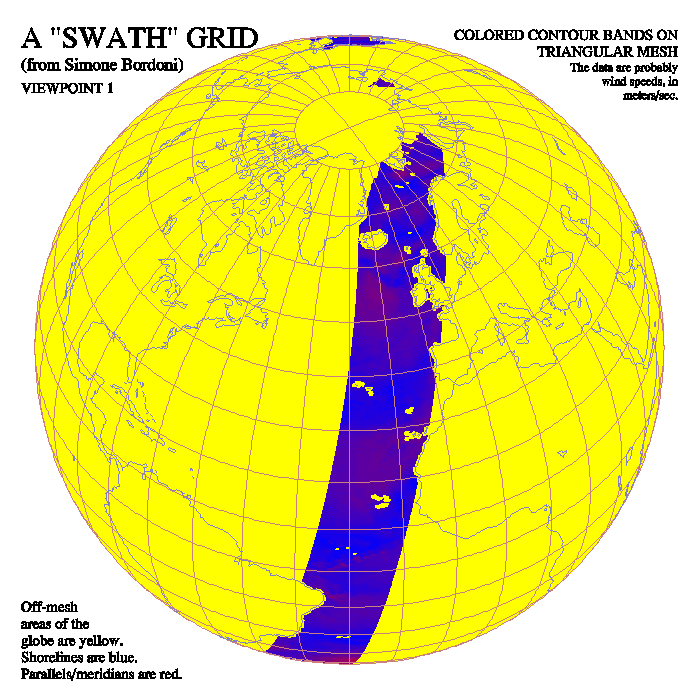
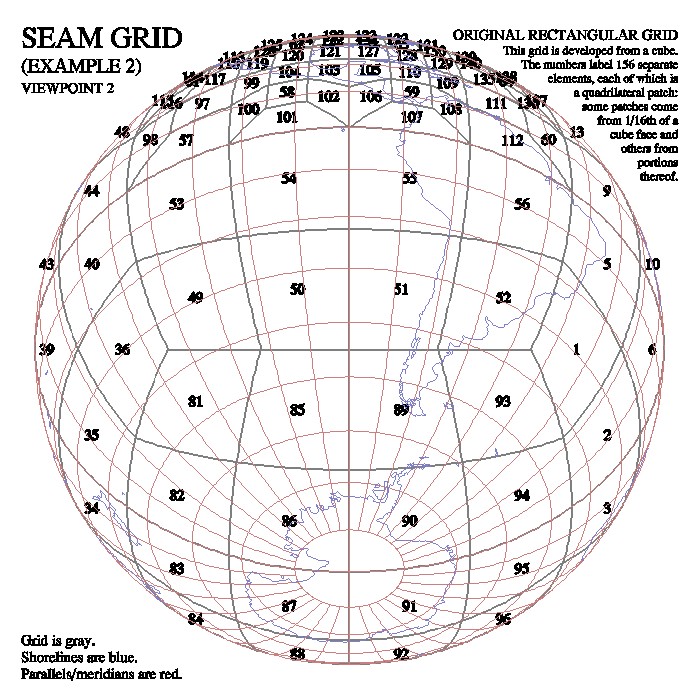
| ctswth ("swath" grid)
| ctwng2 (SEAM grid)
|
|
| 
| 
| 
| 
| 
|
| Click on any image to see it enlarged.
|
Using CONPACKT, one can now draw views of contours and contour bands
on surfaces in 3D. The routines to do this sit inside CONPACKT, but
they have hybrid names of the form "CTTDxx", to reflect the fact that
they may be viewed as extensions of both CONPACKT and TDPACK.
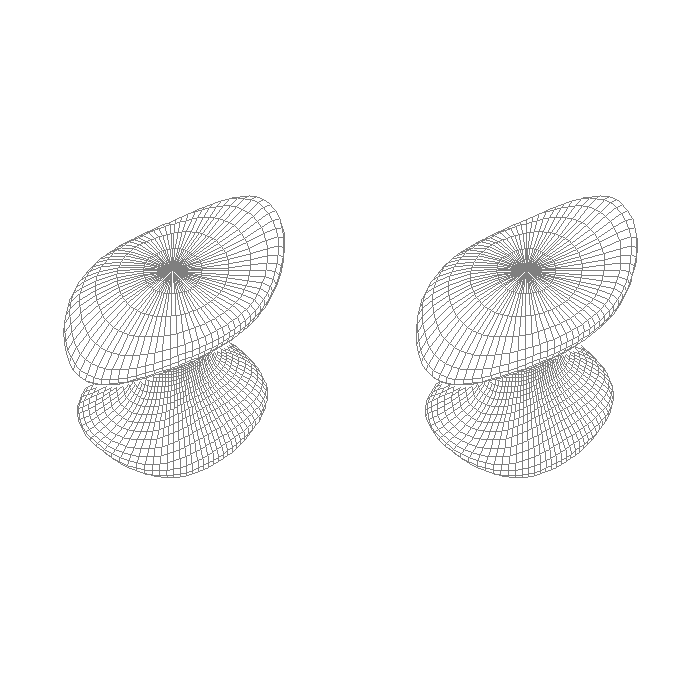
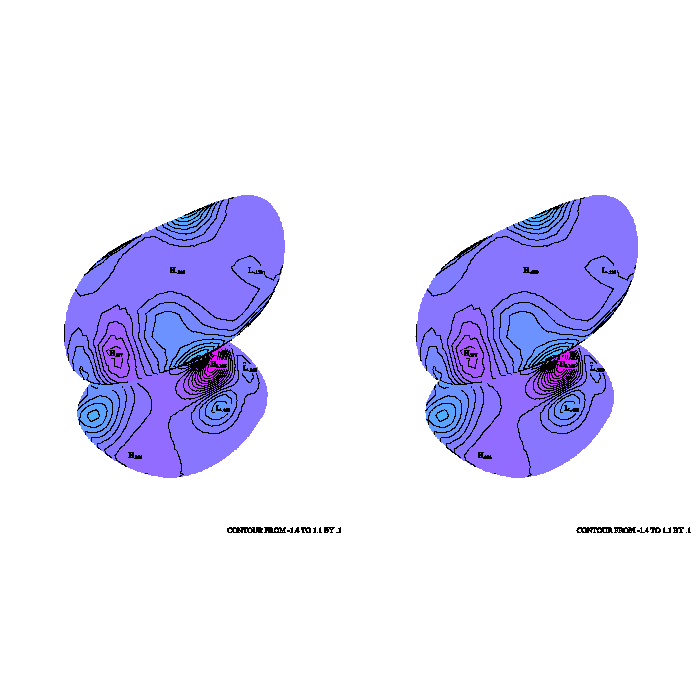
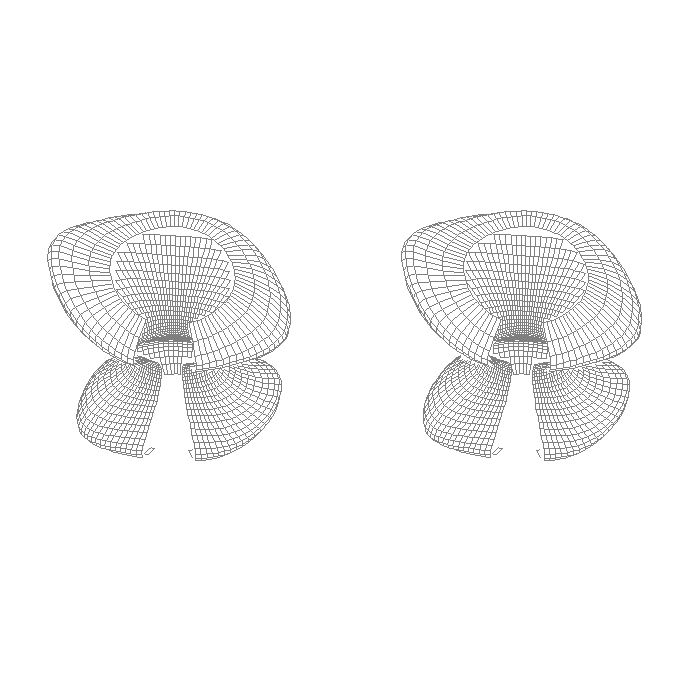
| CONPACKT/TDPACK examples
|
| cttd01
| cttd02
|

| 
| 
| 
|
For more information, see the CONPACKT programmer document:
http://www.ncarg.ucar.edu/supplements/conpackt/
For a list of all the available CONPACKT examples, type;
ncargex -conpackt -list
New PDF driver
A PDF workstation was added to NCAR Graphics, allowing you to direct
your graphical output directly to a PDF file. The method is similar to
how you currently send your output to a PostScript or NCGM file. For
more information, see the section "PDF Output"
in the User's Guide
for NCAR GKS-0A Graphics.
Also, most of the "ncargex" examples can be run so that the output
goes to a PDF file. For example, the following will produce a PDF file
called "ctcbay.pdf":
ncargex -W pdf ctcbay
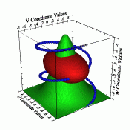
New updates in Tdpack
A new routine called "TDCURV" was added that allows you to draw the
projection of a curve in 3-space. A cone-shaped arrowhead may be drawn
at the end of this curve.
For more information, see the TDPACK programmer document:
http://www.ncarg.ucar.edu/supplements/tdpack/
For a Fortran example, type:
ncargex tdex08
or see the file tdex08.f, whose output
is shown below:
| "tdex08" example
|
|
| Click on image to see it enlarged.
|
Double precision version of Fitgrid
A double precision version of the Ngmath package
Fitgrid
was added. Both Fortran and C user entries are available. For information
on the routine names and to see some examples, see:
http://www.ncarg.ucar.edu/ngmath/fitgrid/functions.html
http://www.ncarg.ucar.edu/ngmath/fitgrid/examples.html
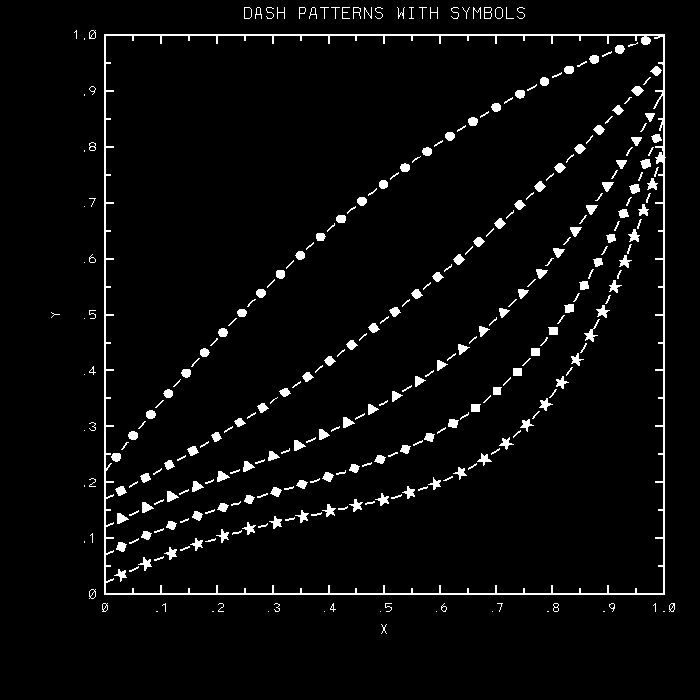
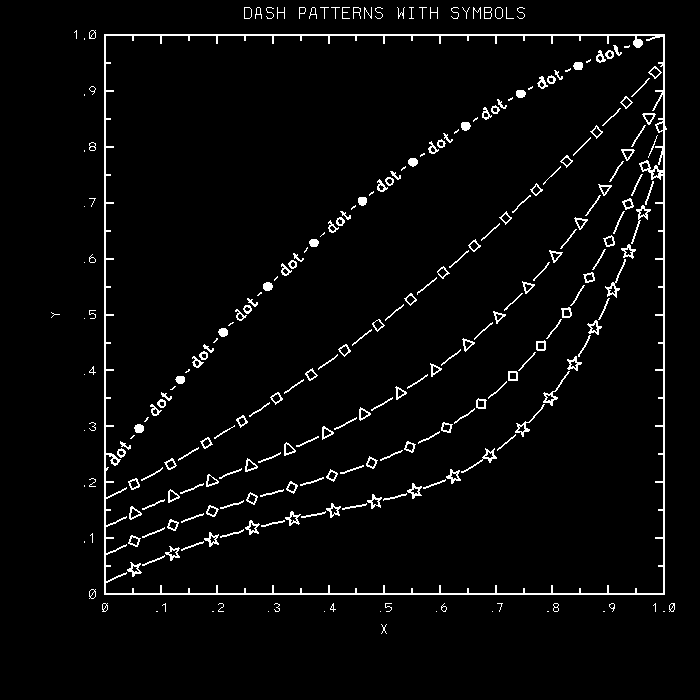
AUTOGRAPH changes and udpates
- AUTOGRAPH updated to use DASHPACK routines
The example "agdp01" shows how to make AUTOGRAPH use the "new" dash
package, called DASHPACK (which was written in 1994) instead of the
"old" dash package, called DASHCHAR. All that one has to do is to
load replacement versions of the DASHCHAR routines called by
AUTOGRAPH, implemented by calling the appropriate DASHPACK routines;
the necessary Fortran code is included in the example.
Among the advantages of using DASHPACK is that one may then define
dash patterns specifying the use of arbitrary symbols (also new in
this release). By default, one may use circles, squares, triangles,
diamonds, and stars, filled or unfilled; one may also define one's own
symbols.
For details, see the programmer documents for
AUTOGRAPH
and DASHPACK.
To generate the "agdp01" example, type:
ncargex agdp01
or see the file agdp01.f, whose output
is shown below:
| "agdp01" example
|
| 
|
| Click on image to see it enlarged.
|
- AUTOGRAPH code modified to address significant slow-down issue
a na
A user reported that some AUTOGRAPH code he wrote ran significantly
slower using version 4.3.x of NCAR Graphics. To fix this, some
AUTOGRAPH calls to SFLUSH were replaced by buffer-flush calls to
PLOTIF, thereby avoiding unnecessary inflation of the metafiles with
filler bytes and speeding up the code.
IFTRAN source code now part of distribution
The IFTRAN source for some of the utilities is now part of the NCAR
Graphics distribution. This is invisible to the user, but it makes it
easier if you need to get into the NCAR Graphics source code and debug
it.
What's new in version 4.3.1
- Cleaned up source code to make it compile easier on Linux systems.
- Fixed a bug in ictrans/med on Linux systems that caused NCGMs
not to append correctly.
What's new in version 4.3.0
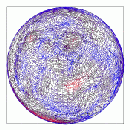
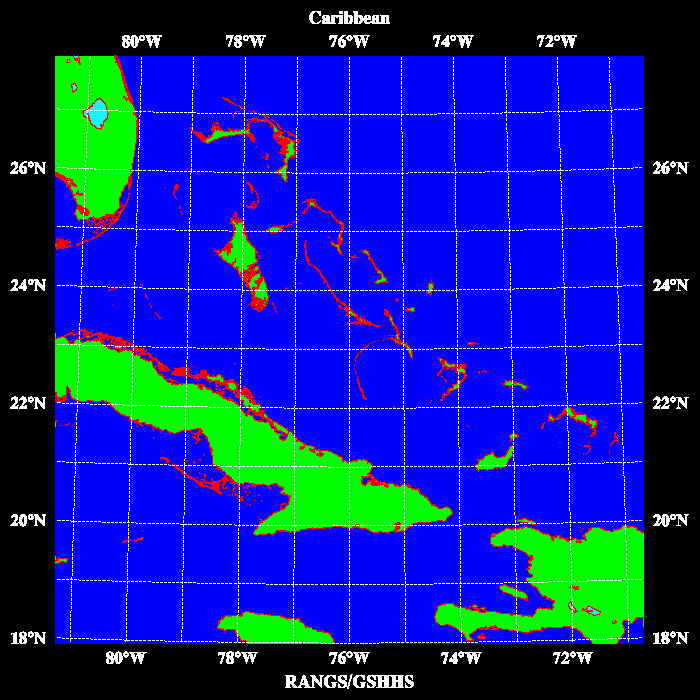
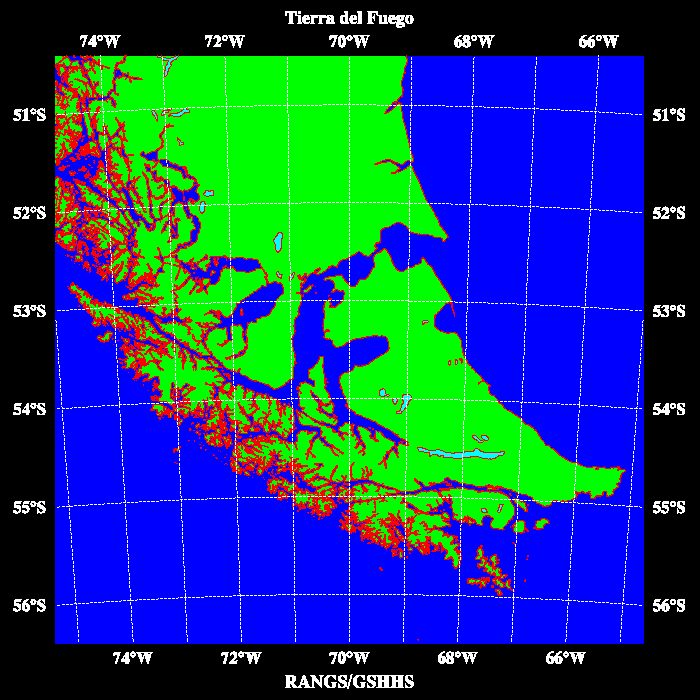
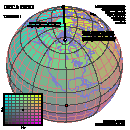
High resolution coastlines added to Ezmap
The Ezmap database was modified to provide access to the very high
resolution coastline database RANGS (Regionally Accessible Nested
Global Shorelines), developed by Rainer Feistel from Wessel and
Smith's GSHHS (Global Self-consistent Hierarchical High-resolution
Shoreline) database.
To access the high-resolution coastlines, you must first download the
RANGS/GSHHS database from Rainer Feistel's web site at http://www.io-warnemuende.de/homepages/rfeistel/.
Right before the section entitled "Some WWW Links", you should see a
little table with ten *.zip files to download:
           rangs(0).zip         gshhs(0).zip
           rangs(1).zip         gshhs(1).zip
           rangs(2).zip         gshhs(2).zip
           rangs(3).zip         gshhs(3).zip
           rangs(4).zip         gshhs(4).zip
Download all ten files, unzip them, and either put them in the
directory "$NCARG_ROOT/lib/ncarg/database/rangs", or put them
somewhere else and set the environment variable NCARG_RANGS to this
directory. The files take up about 140 megabytes, unzipped.
For more information, see the section "Routines
Used to Access the RANGS/GSHHS Data", in the Ezmap programmer document.
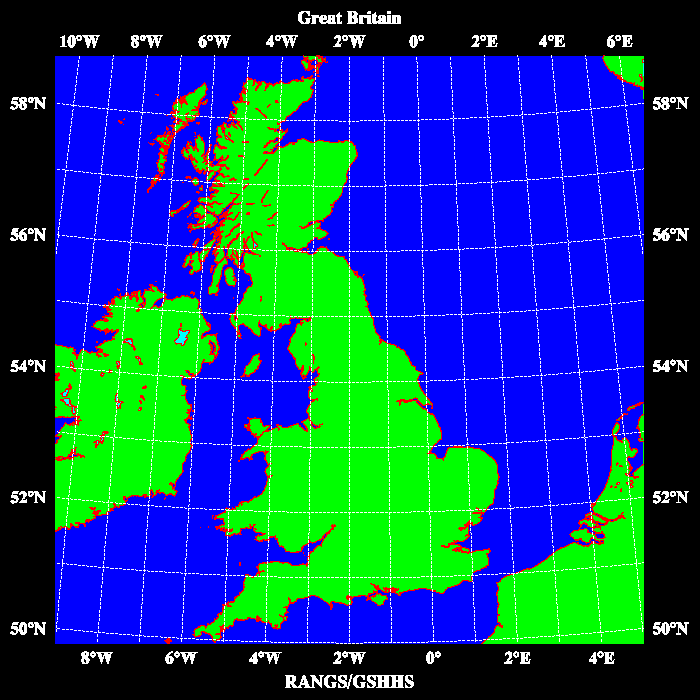
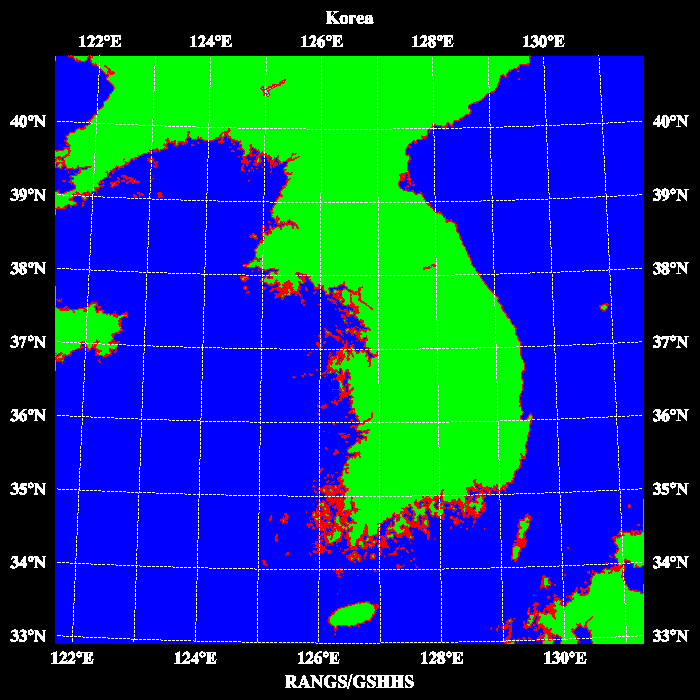
For a Fortran example, type:
ncargex mpex13
or see the file mpex13.f, whose output
is shown in the table below:
| "mpex13" example
|
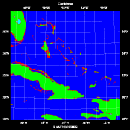
| 
| 
| 
|
| Click on any image to see it enlarged.
|
"ezmapdemo" program updated to include high-resolution coastlines
The "ezmapdemo"
program was updated to recognize the new RANGS/GSHHS database that was
added to Ezmap, and to display the new style of latitude/longitude
labels along the edge of a rectangular grid.
SUPMAP updated to allow access to Ezmap databases
The Fortran routine SUPMAP was updated to
allow access to the "Earth..2" or "Earth..3" database, via the
IOUT argument.
Added Nauru to the "Ezmap..2" database
The Pacific
island of Nauru was added to the "Ezmap..2" database. For an
example, or to see what Nauru looks like, compile nauru.f and view the resulting metafile:
ncargf77 -o nauru nauru.f
./nauru
ctrans -d X11 gmeta
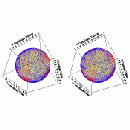
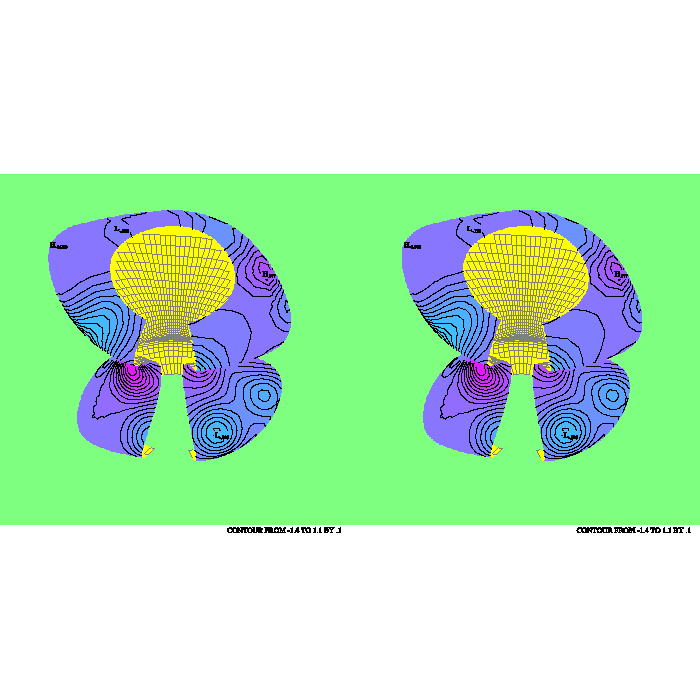
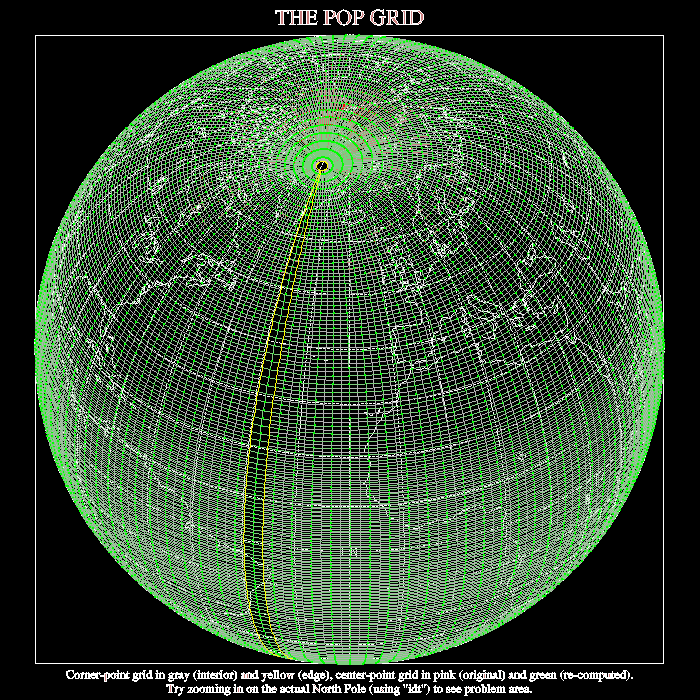
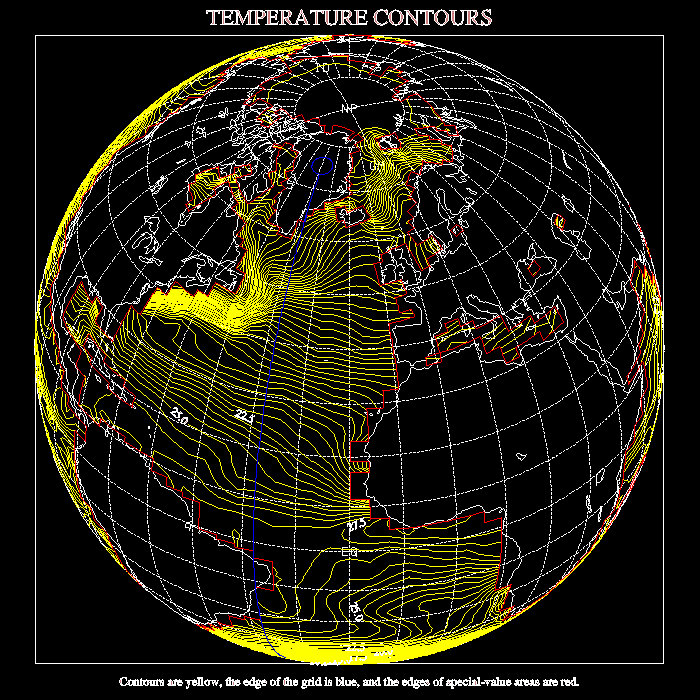
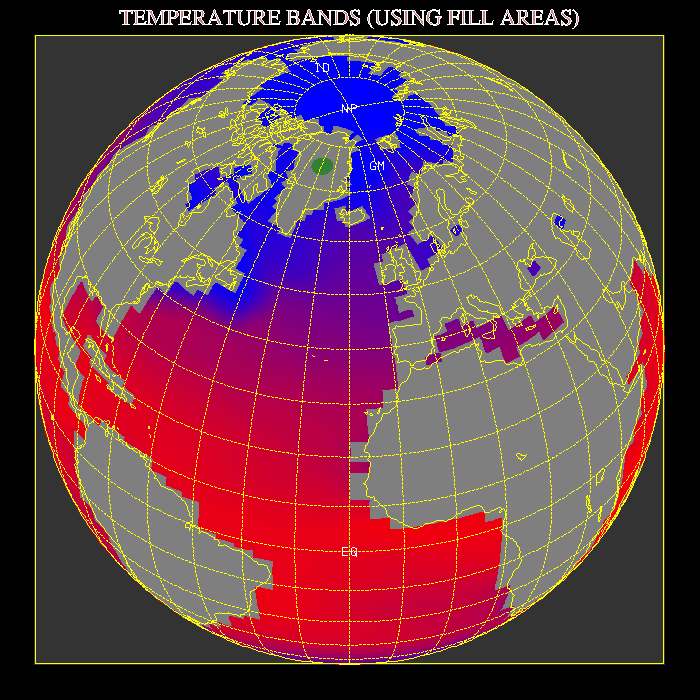
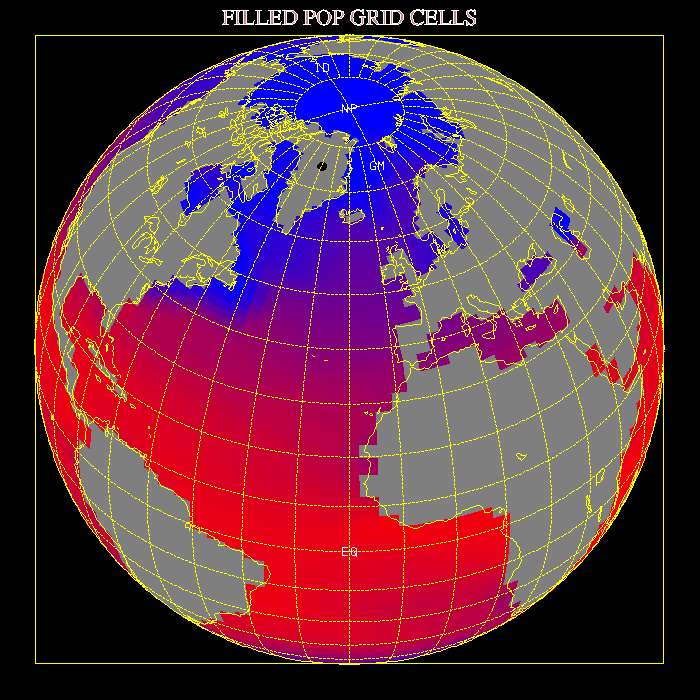
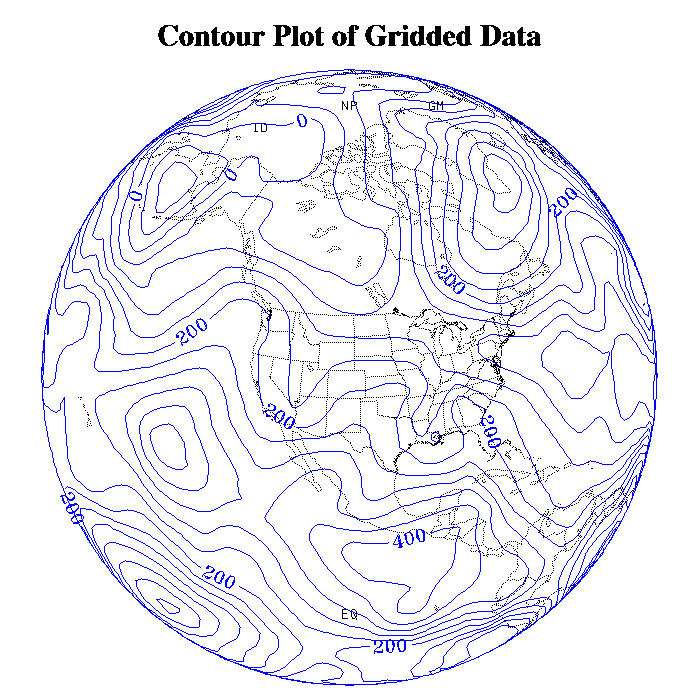
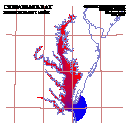
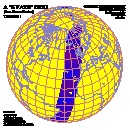
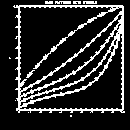
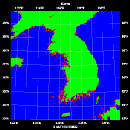
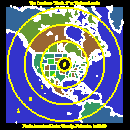
Example of contouring a POP grid added to Conpack
A new Conpack example "cpex16" was created to show how to contour
a POP
(Parallel Ocean Program) grid. To generate this example, type:
ncargex cpex16
The output is shown in the table below:
| "cpex16" example
|
| 
| 
| 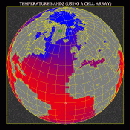
| 
|
| Click on any image to see it enlarged.
|
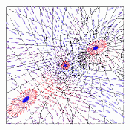
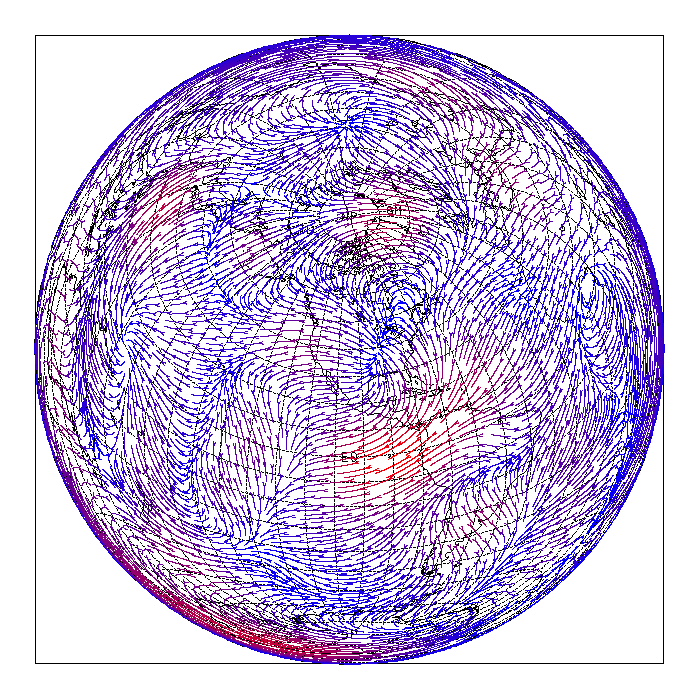
Curly vectors added to Streamlines
The ability to create curly vectors has been added to the Streamlines
package, via the STM
parameter. Also, you can create progressively colored
streamlines. That is, you can have the streamlines vary in color along
their length, based on some scalar quantity.
For more information on curly vectors, see the sections "Streamline
Modes" and "Color
Threshold Level Control" in the Streamlines
document.
Trajectory capability added to three-dimensional plotting package (Tdpack)
A new routine called TDTTRI
was added that provides a trajectory capability. TDTTRI adds triangles
defining a collection of 3D markers to the triangles in a triangle
list. The 3D markers are evenly distributed along a user-defined
trajectory. To generate an example showing this feature, type:
ncargex tdex07
The output is shown in the table below:
| "tdex07" example
|
|
| Click on image to see it enlarged.
|
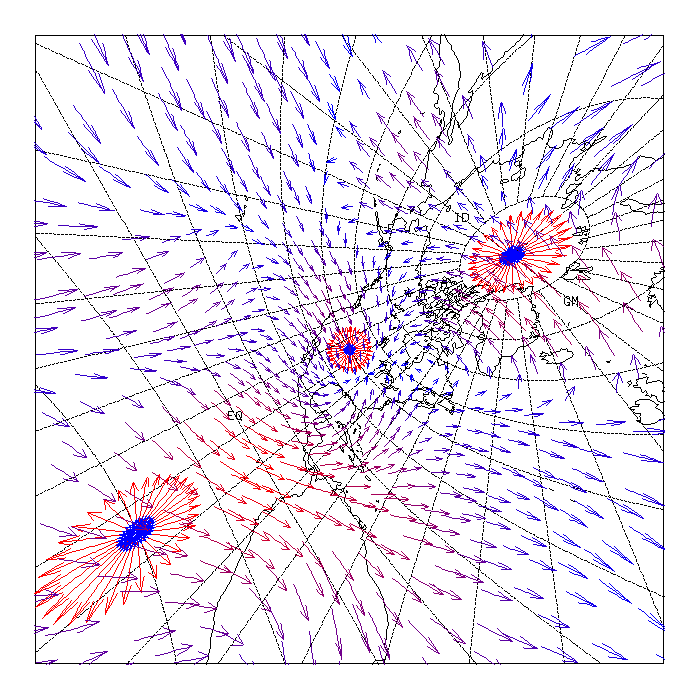
New capabilities added to weather map package (Wmap)
The parameter WDF was
added to Wmap to allow you
to reverse the wind directions in the wind barb routine WMBARB.
The parameter SMF was
added to Wmap to allow you to use smoothing splines when drawing front
lines. The smoothing splines are splines that are calculated using a
least squares fit, rather than the natural splines that pass through
the original data points.
A new example "wmex15" was added to show how to draw wind barbs on a
map. To generate this example, type:
ncargex wmex15
The output is shown in the table below:
| "wmex15" example
|
|
| Click on image to see it enlarged.
|
New logo drawing routines added
New Fortran routines "nglogo" and "ngezlogo" (C routines "c_nglogo"
and "c_ngezlogo") were added that draw various NCAR and UCAR logos on
a plot. Also, a new application called "ncarlogo2ps" was added that
adds an NCAR logo to an existing PostScript file. See the man pages
for "nglogo", "ngezlogo", and "ncarlogo2ps" for more information.
To generate an example, type:
ncargex miex01
The output is shown in the table below:
| Logo example
|
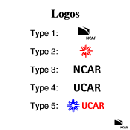
|
| Click on image to see it enlarged.
|
Source updated to compile under Cygwin
The NCAR Graphics source code was modified significantly to get it to
build under Cygwin, a UNIX
environment developed by Red Hat, for Windows.
What's new in version 4.2.3
- A tar file of the NCAR Graphics documentation has been included
on the download page.
- Some files had to be updated so that NCAR Graphics could be built
under Linux RedHat 7.1 using the 2.96 version of the GNU compilers.
What's new in version 4.2.2
- Some configuration files were changed so that the source would build
better under Linux systems with different compilers.
What's new in version 4.2.1
What's new in version 4.2.0
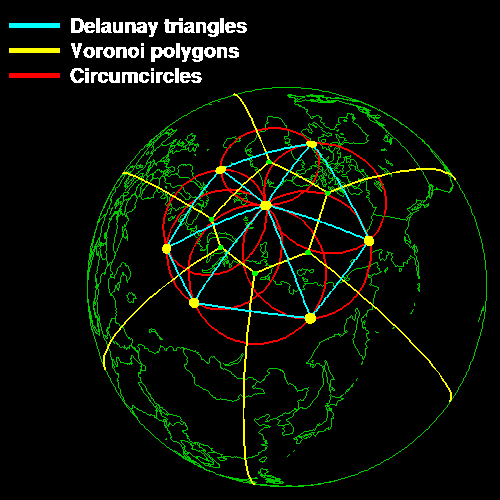
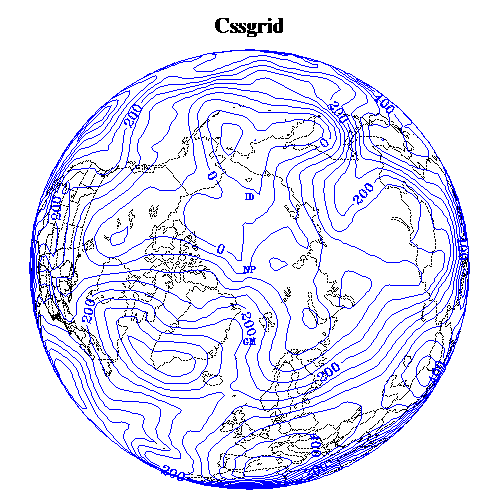
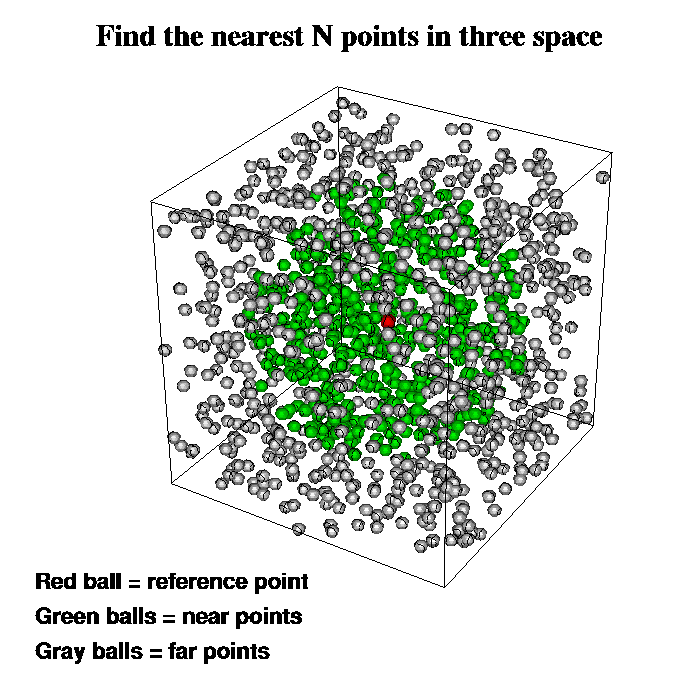
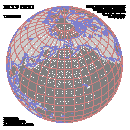
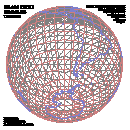
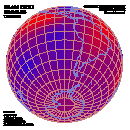
Two new packages have been added to the Ngmath library: Cssgrid
and Shgrid. Cssgrid is an interpolation package for random data
on the surface of a sphere which uses cubic splines to calculate its
interpolation function. Shgrid is an interpolation package for random
data in 3-space which uses a modified Shepard's algorithm to
calculate its interpolation function.
Both Cssgrid and Shgrid are based on the work of Robert Renka.
For more information on Cssgrid and Shgrid, see:
http://www.ncarg.ucar.edu/ngmath/cssgrid/csshome.html
http://www.ncarg.ucar.edu/ngmath/shgrid/shhome.html
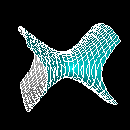
| Cssgrid examples
|
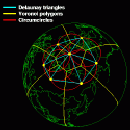
| 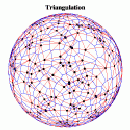
| 
|
| Click on any image to see it enlarged.
|
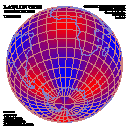
| Shgrid examples
|
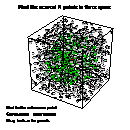
| 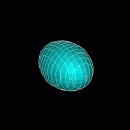
| 
|
| Click on any image to see it enlarged.
|
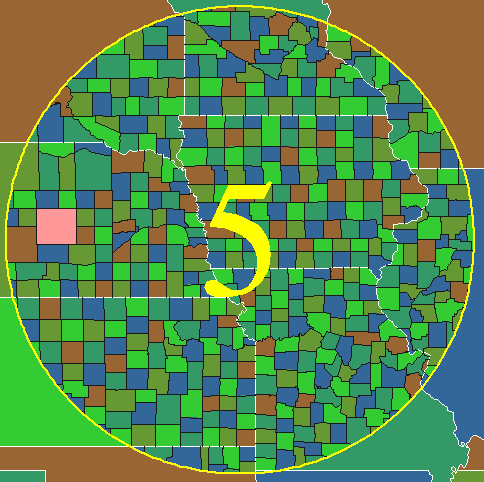
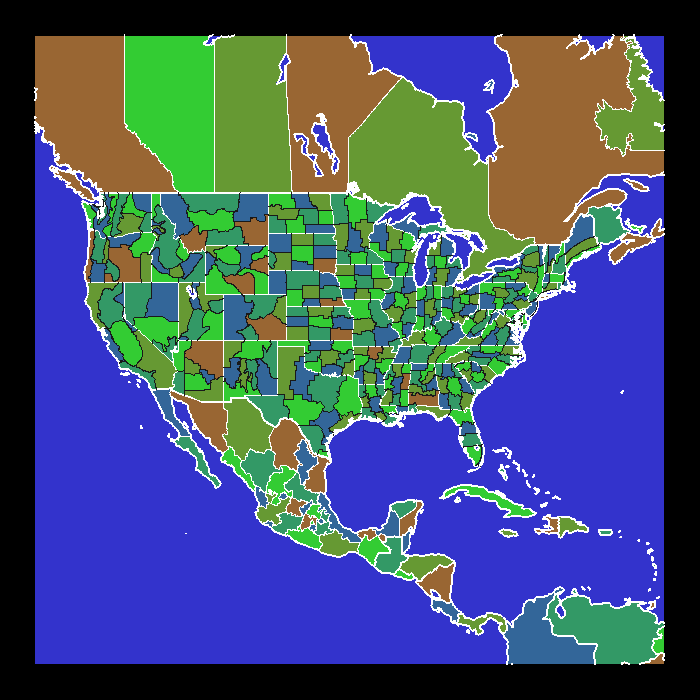
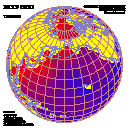
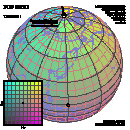
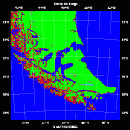
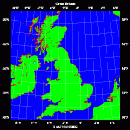
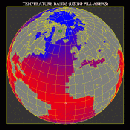
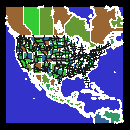
Canadian provincial boundaries, Mexican state boundaries, and
U.S. state and county boundaries were added to Ezmap. For information
on how to access these new boundaries, see the Ezmap
programmer document.
Ezmap example with
added boundary lines
| Same example, zoomed in
on inner circle
| Ezmap example with
climate divisions
|
| 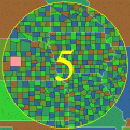
| 
|
| Click on any image to see it enlarged.
|
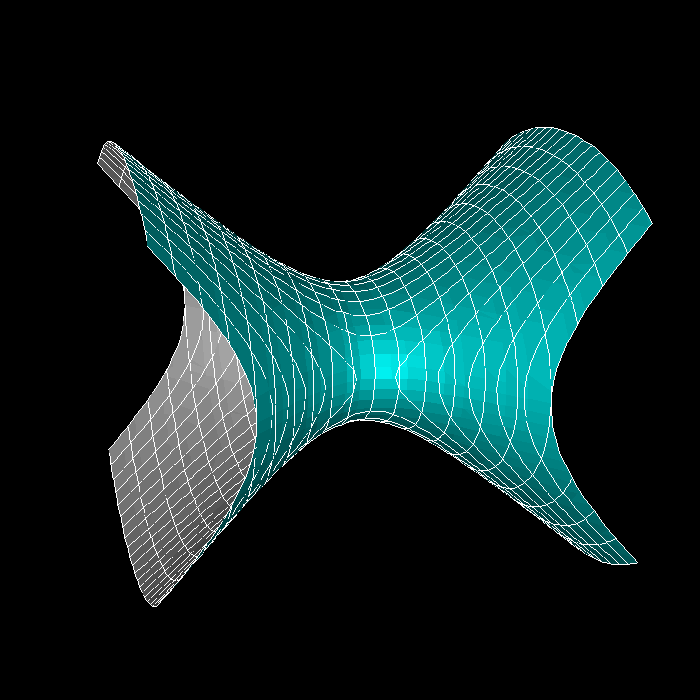
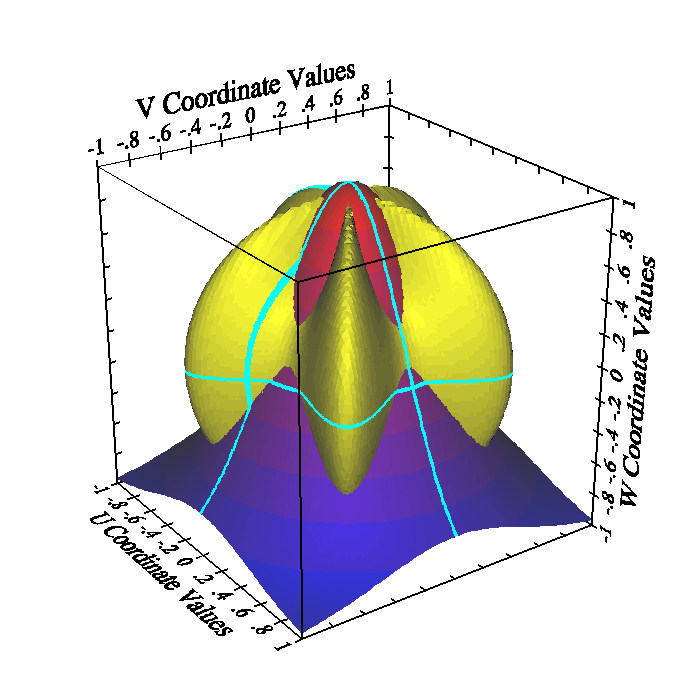
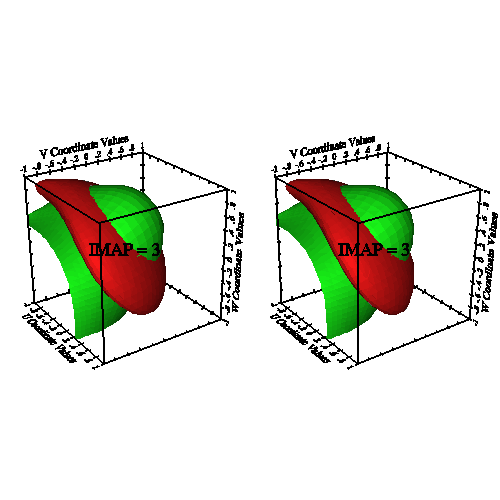
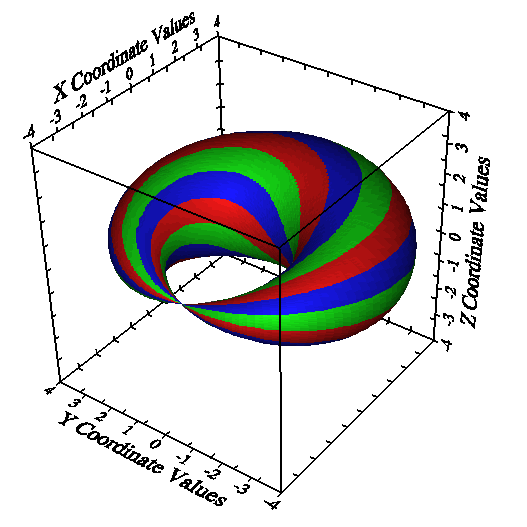
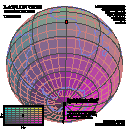
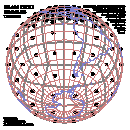
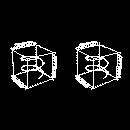
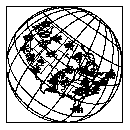
A new routine (TDCTRI) was added to Tdpack that processes a list of
triangles and cuts in half each one that intersects a specified plane
perpendicular to one of the three axes. This makes it possible to
render objects with shading that depends on the U, V, or W position of
the triangles. For information on using this routine, or any other
routine in Tdpack, see the Tdpack programmer
document.
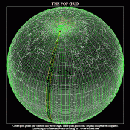
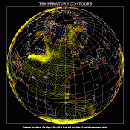
| New Tdpack examples
|
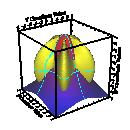
| 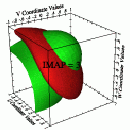
| 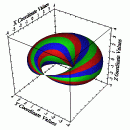
|
| Click on any image to see it enlarged.
|
The command "ezmapdemo" is
an interactive program allowing one to access most of the features of
Ezmap, including the database "Earth..1", added in 1998, the database
"Earth..2", added in 1999, and the new projections from the USGS
package called GCTP (the General Coordinate Transformation
Package).
"Ezmapdemo" does not have a "point-and-click" interactive interface;
instead, one types simple commands into a dialog window and observes
the effects in a display window.
One is allowed to access any of 66 predefined example plots; the first
11 of these illustrate the map projections traditionally available
from Ezmap, the next 33 illustrate new map projections available from
the USGS package, and the remaining 22 show all of the State Plane
zones that are defined by the USGS package as part of the State Plane
coordinate system.
One easy way to use the demo is to call up a particular example and
then modify it in various ways (as, for example, to make it use a
different outline dataset). See the Ezmap programmer document for a
number of
plots that were produced in this way.
The command "tdpackdemo"
is an interactive program allowing one to investigate the capabilities
of Tdpack. To run this
demo, type:
tdpackdemo
This will create an X window containing an initial display of a simple
surface. Commands may then be typed in the original window, directing
the demo program to change the X-window display in various ways. A
little experimentation should suffice to learn what is possible. A
good place to start is with an "H" command, which will give you a list
of all the possible commands.
Several new C and Fortran examples were added to show how to use the
new Ngmath packages, how to access the new boundaries in Ezmap, and
how to do more with the Tdpack utility. To generate these new
examples, type:
ncargex -cssgrid -shgrid
ncargex mpex11
ncargex tdex04 tdex05 tdex06
You can now list and/or generate the examples associated with each Ngmath package (Natgrid, Dsgrid,
Fitgrid, Cssgrid, Csagrid, and Shgrid) using ncargex. To list
them, use the "-list" option:
ncargex -natgrid -list
ncargex -dsgrid -list
ncargex -fitgrid -list
ncargex -cssgrid -list
ncargex -csagrid -list
ncargex -shgrid -list
A programmer document for the
SPPS utility was added.
The ncarg-talk messages have been archived and put on the web:
http://www.ncarg.ucar.edu/ncarg-talk/
Contact webmaster