Chapter 1: Overview of functionality
Previous chapter LLUs Home Next chapter Index
NCAR Graphics Version 3.2 can be divided into two parts. The first part will be called "utilities" or "low level utilities" in this document. These utilities are written in Fortran and stored as object or archive libraries, and can be accessed from a C or Fortran program that you write. The second part of NCAR Graphics 3.2 is a set of commands or tools that allow you to compile your programs, run examples, view, print, and edit NCAR Graphics Computer Graphics Metafiles (NCGM) files, and more.
With Version 3.2 there are now user entry points for C as well as Fortran to facilitate new code development by C programmers. We have also added a new display option so that you can run your program, and have graphics displayed directly to as many as 15 different X Windows, or a NCGM file.
Below is a guide to the current functionality of both the NCAR Graphics utilities and the UNIX command tools.
All NCAR Graphics utilities use the Graphical Kernel System (GKS) to produce output. NCAR Graphics comes with its own Level 0A implementation of GKS with some extensions to the 2B level. NCAR Graphics can run on other implementations of GKS.
The Plotchar utility draws characters and symbols using 20 different fonts. Characters can be stroked, filled, or drawn using the printer default, giving you options on speed of printing, and very high quality fonts. Plotchar also offers Greek characters and a wide variety of mathematical symbols. With Version 3.2 we now have a utility to draw meteorological symbols and a variety of filled fonts.
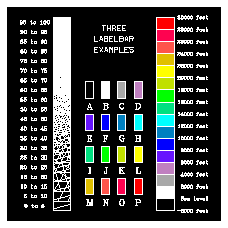
The Labelbar utility helps you create a labeled, filled, rectangular bar to serve as a key for filled plots.
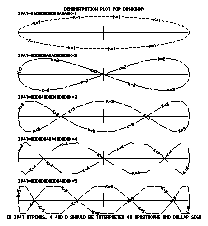
NCAR Graphics offers numerous routines for drawing lines and curves. The Dashline utility allows you a nearly infinite variety of dash and character patterns to draw lines, as well as a variety of smoothing options.
Used in conjunction with line drawing, mapping or contouring utilities, the Areas utility allows you to retrieve (or recover) outline and other information about each region. Also, Areas allows you to overlay two or more groups or sets of lines, and to recover the regions defined by the union of the groups. It can also tell you where each region is located relative to each group of lines. These features allow you to mask contour lines or latitude/longitude lines over the ocean and color-fill or pattern-fill regions, among other things. Areas is covered in detail in the NCAR Graphics Contouring and Mapping Tutorial.
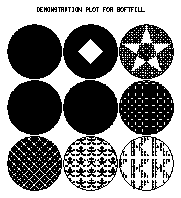
NCAR Graphics also offers numerous options for filling areas. The Softfill utility can be used to generate nearly any kind of fill pattern or color, or GKS can be used directly to do solid color fill.
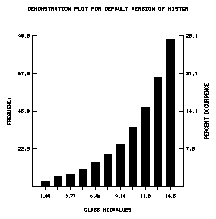
The Histogram utility is used to generate histograms for single data arrays or for comparing the distributions of two data arrays.
A color space, or color model, is a three-dimensional coordinate system where coordinates in that system represent colors. Colconv allows you to convert between several of the more common color models, namely RGB (Red, Green, Blue) used by most workstations, the YIQ model used by broadcast TV, the HLS (Hue, Lightness, Saturation), and the HSV (Hue, Saturation, Value) models.
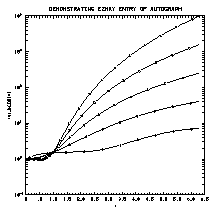
The Autograph utility helps you draw X/Y graphs of one or more curves with labeled backgrounds. Autograph provides facilities for differentiating curves, doing log scaling, and other useful options.
The Gridall utility provides nine options for generating axes, perimeters, and grids in both linear and logarithmic spaces.
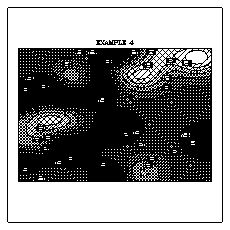
Conpack is a color contouring utility. Conpack can be used to generate plots of almost any rectangular array of data, and allows an amazing degree of control over how the contours are presented. Bivar, a bivariate interpolation package, has been added to the NCAR Graphics libraries to help users contour irregularly spaced data. In Version 3.2, we have added a cell array option to Conpack to help you draw color or shaded plots of densely packed data. This option can produce very detailed plots in much less time than other Conpack routines. Conpack and Bivar are covered in the NCAR Graphics Contouring and Mapping Tutorial.
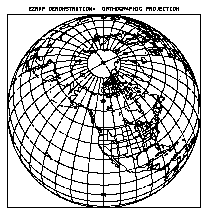
Ezmap offers ten different projections of the globe, the ability to precisely choose which portion of the globe that you would like to plot, and a selection of political and geographic outlines. In Version 3.2, inverse transformations are available to help you go back from the plotted map to your data values. Ezmap is covered in the NCAR Graphics Contouring and Mapping Tutorial.
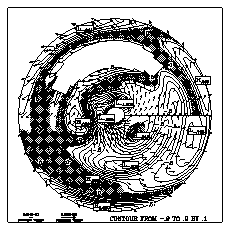
The Vectors (previously called Velvct) and Streamlines (previously called Strmln) utilities offer two options for drawing field flows. Both utilities have been updated to allow easy mapping onto globes or other transformations, and masking over regions of your choice. The Vectors utility has been updated to color vectors according to an independent field, such as temperature.
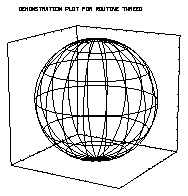
The utility for drawing X/Y/Z plots is Threed. It offers options for drawing text, points, curves, and fences to nearly any perspective.
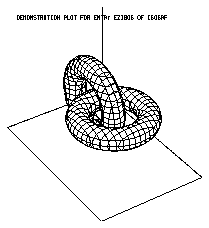
The Isosurface utility draws a wire frame approximation of an isosurface from a three- dimensional array. The Surface utility draws wire frame perspectives of functions of two variables.
Gflash routines store and insert picture segments that appear repeatedly in a movie, greatly reducing the amount of CPU time it takes to generate movies. The Scrolled_title utility provides options for titling movies.
NCAR Graphics offers numerous UNIX command tools to make life easier.
Run-time commands. Run-time commands, such as ncargf77 and ncargcc, help compile, link, and load your program in a single step, eliminating needless typing. The ncargex command copies the example of your choice into your directory and executes it so that you can study and modify the code to do what you want. This command can greatly reduce development time of new codes, as well as NCAR Graphics spin-up time. See the chapter, "Five quick steps for creating and viewing your graphic."
NCGM viewing and editing. The NCGM viewing and editing tools include command-line tools for text- based terminals and Graphical User Interface (GUI) tools for the X Window System. Both viewing tools allow you to view any frame in your NCGM file in any order. The GUI interface allows you to view your graphics sequentially, animate a NCGM, and zoom in on portions of the picture for a closer look. Editing tools allow you to overlay images, merge and split NCGM files, and delete or add plots from an NCGM.
Raster viewing and editing. With Version 3.2, we have added several new utilities that allow you to view, concatenate, and resample raster images in different formats. See the chapter, "Viewing and editing your CGMs and raster images."
Graphical format conversions. We have also introduced a variety of filters that will help you view NCAR Graphics NCGM files with other graphics systems, and vice versa.
Previous chapter LLUs Home Next chapter Index
