Special thanks to David Kennison and Bob Lackman for reviewing this document. Also, thanks to Dennis Joseph and Ken Hansen for sharing their wind barb program and Dave Kennison for providing the example of wind barbs on a world map.
Copyright 1996 University Corporation for Atmospheric Research (UCAR)
All Rights Reserved
Published by: National Center for Atmospheric Research, Scientific Computing Division, P.O. Box 3000, Boulder, CO 80307-3000. The National Center for Atmospheric Research is operated by the University Corporation for Atmospheric Research and is sponsored by the National Science Foundation. Any opinions, findings, and conclusions or recommendations expressed in this publication are those of the authors and do not necessarily reflect the views of the National Science Foundation.
The functionality of the package, and the documentation, is broken into: plotting front lines; plotting regions showing weather type or temperature zone; plotting city names and daily high/low temperature readings; plotting regional weather labels (like "BREEZY," "HUMID," and so forth); plotting regional temperature labels with optional arrows; plotting special symbols (like ones for high and low pressure) and icons representing daily weather; plotting map legends; plotting wind barbs and station model data.
Either C or Fortran procedures may be invoked to effect the above functionality. In the descriptions of the procedures, the Fortran entry will be described in detail. A synopsis of the equivalent C procedure follows.
The basic programming approach is to set values for internal parameters that control various aspects of the output and then invoke the appropriate C or Fortran procedure. For a complete list of, and an explanation of how to set and retrieve values for, the internal parameters available in this package, consult the section Setting and Retrieving Internal Parameters. An easy way of using this package is to thumb through the example plots in Appendix A to find that plot that illustrates what you want to do, then modify the code that produces that plot to accomplish the desired goal. See the EXAMPLES section to find out how to retrieve and run the codes that produce the plots in Appendix A.
Fortran:
CALL WMDRFT(N,X,Y)
where X and Y are linear arrays of dimension N and ((X(I),Y(I)),I=1,N) are world coordinate values.C:
    #include <ncarg/ncargC.h>
    void c_wmdrft(int n, float *x, float *y)
where the parameters are analogous to the Fortran ones.
The coordinate values are used as control points for a spline curve fit. By default the curve passes through the given coordinates. You can flag the use of a smoothing spline (a least-squares spline fit that does not go through the given coordinates) by setting the control parameter SMF to 1. If the front has little curvature, then only a few points need to be specified to get a nice smooth curve. See Figure 2 in Appendix A for an illustration.
If a non-negative value is specified for NMS, then precisely NMS symbols will be drawn along the front line, regardless of the settings for BEG, END, BET, and SWI. Setting the value of NMS to zero results in drawing a spline curve along the front line coordinates with no symbols appearing along it.
It is possible to specify the exact sequence in which warm front and cold front symbols appear along a front line, as well as which side of the line they point. The internal parameter array STY is used for this purpose. The legal values for elements of the STY array are plus or minus 1 and plus or minus 2. A "1" will produce a cold front symbol (a small triangle) and a "2" will produce a warm front symbol (a semi-circular bump). The algebraic sign of the elements of STY indicate what side of the front line the symbols will point - a positive value will cause the symbol to point to the right of the line (as traversed from the start to the end), and a negative value will cause the symbol to point to the left. Elements of the STY array are defined by using the internal parameter PAI to indicate which element is being specified and then providing a value for STY. The internal parameter REV can be used to reverse the directions that the symbols along a front line point.
Each of the bumps along a warm front is defined by points along a bezier curve. The default number of points along such a curve is 51 which makes these curves appear smooth at most sizes. If desired, this number can be reset by assigning the desired value to NBZ.
See the table of internal parameters for details on the internal parameters discussed in this section. See Figure 4 in Appendix A for an example that illustrates the use of the internal parameters BEG, BET, END, NMS, SWI, STY, PAI, and REV.
See the table of internal parameters for details on the internal parameters discussed in this section. See Figures 1, 4, and 14 in Appendix A for examples that illustrate setting colors for front lines.
See the table of internal parameters for details on the internal parameters discussed in this section. See Figure 3 in Appendix A for an example that illustrates setting endpoint slopes.
See the table of internal parameters for details on the internal parameters LIN, DWD, and WTY.
Fortran:
CALL WMDRRG(N,X,Y,ITYPE,NC,XC,YC)
where X and Y are linear arrays of dimension N and ((X(I),Y(I)),I=1,N) are world coordinate values specifying a region. A spline fit is effected using the input coordinates so that only a few coordinates are needed to specify a smooth region. The spline fit passes through the input coordinates. See figure 2 in Appendix A for an example of a region defined by seven points. The region constructed is filled with either patterns or a solid color depending on ITYPE.The legal values for ITYPE are:
| ITYPE | = 'T' for thunderstorms.
|
| = 'SH' for showers.
| |
| = 'R' for rain.
| |
| = 'F' for snow flurries.
| |
| = 'SN' for snow.
| |
| = 'I' for ice.
| |
| = 'INDEXnn' where nn denotes a color index to use for the fill. |
If NC is greater than 2, then the region resulting from the spline fit to ((X(I),Y(I)),I=1,N) will be clipped against the region in ((XC(I),YC(I)),I=1,NC). If no clipping is to be done, then set NC equal to 1.
C:
    #include <ncarg/ncargC.h>
    void c_wmdrrg(int n, float *x, float *y, char *itype,
                  int nc, float *xc, float *yc)
where the parameters are analogous to the Fortran ones.
Internal parameter RHT can be used to change the size of the symbols in the weather patterns and COL can be used to change the colors. For examples of using WMDRRG, see Figures 2, 5, 13, 14 in Appendix A.
Fortran:
CALL WMLABC(X,Y,CITY,TEMPS)
where X and Y are world coordinates specifying the position of the composite label that consists of the city name in the character variable CITY and the temperature ranges in the character variable TEMPS. For example, if CITY='Boulder' and TEMPS='84/68', then these strings would be plotted with CITY on top and TEMPS below.C:
    #include <ncarg/ncargC.h>
    void c_wmlabc(float x, float y, char *city, char *temps)
where the parameters are analogous to the Fortran ones.
There are four internal parameters that control the appearance of the city labels: CBC, CHT, CMG, and RFC. Each character in the city name and the HI/LOW value is drawn against a background that surrounds the character. The color of this background is controlled by the value of CBC and the extent of the background is controlled by the value of CMG. This background can be used to provide space around the labels for readability. The size of the labels is controlled by the value of CHT and the color of the characters is given by RFC.
Plotting dots to mark the city positions is facilitated by using the entry WMLABS which is described in the section Dots below.
For examples of plotting city names, hi/low data, and dots, see Figures 6, 13, and 14 in Appendix A.
Fortran:
CALL WMLABW(X,Y,LABEL)
where X and Y are world coordinates specifying the center position of the label in the character variable LABEL.C:
    #include <ncarg/ncargC.h>
    void c_wmlabw(float x, float y, char *label)
where the parameters are analogous to the Fortran ones.
The labels are plotted in a rectangle that surrounds the label. This rectangle has a shadow. The internal parameters that control the appearance of the regional weather labels are: RC1, RC2, RC3, RC4, RC5, and WHT. WHT specifies the height of the characters in the label; RC4 specifies the color index of the text in the label; RC1 specifies a color index for the outline of the rectangle surrounding the text; RC2 specifies the color index of the interior of the box; RC3 specifies the color index of the rectangle shadow; and RC5 specifies the color index for outlines around each character in the LABEL (the character outlines are drawn only if RC5 is non-negative). For further details on these internal parameters, see the table of internal parameters.
For examples of plotting regional weather labels, see Figures 6, 13, and 14 in Appendix A.
Fortran:
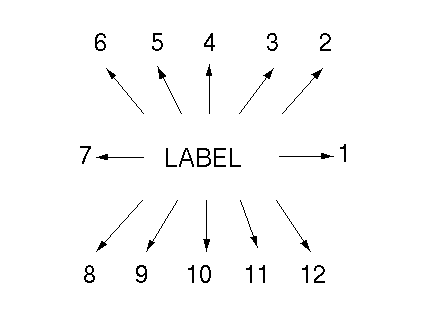
CALL WMLABT(X,Y,LABEL,IPOS)
where X and Y are world coordinates specifying a position for the label in the character variable LABEL. IPOS is a flag for controlling whether an optional arrow is drawn. If IPOS is 0, then no arrow is drawn and the label is centered at (X,Y). If IPOS is between 1 and 12, then arrows are drawn at the positions indicated in the following diagram:
This diagram is but a rough sketch of the positions. For example, if position 4 is requested, the label will appear under the arrow; if position 3 is requested, then the arrow will be on a line that goes through the center of the label at an angle of 67.5 degrees, and so forth.
If an arrow is drawn, then (X,Y) specifies the position at the tip of the arrow.
C:
    #include <ncarg/ncargC.h>
    void c_wmlabt(float x, float y, char *label, int ipos)
where the parameters are analogous to the Fortran ones.
The internal parameters that control the appearance of the regional temperature labels are: RBS, RFC, RLS, ROS, and THT. The appearance of the (optional) arrows is controlled by the internal parameters for arrows (see the section Arrows for details). THT specifies the label height; RFC specifies the color index for the character color; RLS specifies the color index for character shadows; ROS specifies the color index for character outlines (drawn only if this index is non-negative). RBS specifies a color index for background boxes drawn around each character in the temperature label; these background boxes are drawn only if RBS is non-negative. RMG controls the size of the margins for the background boxes. For further details on these internal parameters, see the table of internal parameters.
For examples of plotting regional temperature labels, see figures 6, 13, and 14 in Appendix A.
Fortran:
CALL WMLABS(X,Y,SYMTYP)
where X and Y are world coordinates specifying the center position of the symbol requested in the character variable SYMTYP. The available symbols include symbols for high and low pressure areas, arrows, dots, and icons representing daily weather (such as snow, rain, sun, etc.). These symbols are described in more detail in the subsections of this section.C:
    #include <ncarg/ncargC.h>
    void c_wmlabs(float x, float y, char *symtyp)
where the parameters are analogous to the Fortran ones.
If SYMTYP='LOW', then a circular symbol with an "L" in it will be drawn at position (X,Y). The internal parameters controlling the appearance of the low pressure symbols are: SHT, LOF, LOB, LOC, LOS. SHT controls the size of the symbol; LOF specifies the color of the "L" inside the circle; LOB specifies the color of the interior of the circle; LOS specifies the color of the symbol shadow. If any of the color indices is set negative, then that particular feature will not be drawn at all. For further details on these internal parameters see the table of internal parameters. For examples of the usage of low pressure symbols, see figures 6, 13, and 14 in Appendix A.
| 1 | 'CLOUD' |
| 2 | 'ICE' |
| 3 | 'IS' (Intermittent showers) |
| 4 | 'IT' (Sunny, chance of T-storms) |
| 5 | 'MC' (Mostly cloudy) |
| 6 | 'MS' (Mostly sunny) |
| 7 | 'RAIN' |
| 8 | 'RS' (Rain and snow) |
| 9 | 'SNOWFLAKES' |
| 10 | 'SUN' |
| 11 | 'THUNDERSTORM' |
| 12 | 'WIND' |
Fortran:
CALL WMLGND(X,Y,NTYPE,IROWS,ICOLS)
where X and Y are world coordinates. NTYPE specifies what legends are to be drawn:
| NTYPE = 1 | Plot the legend for the weather types. There are six weather types: showers; T-storms; rain; flurries; snow; ice. The coordinate (X,Y) for this type specifies the lower left corner of the legend. |
| = 2 | Plot the legend for front types. There are three front types labeled: cold; warm; stationary. The (X,Y) coordinate for this legend specifies the lower right corner of the legend. |
| = 3 | Plot the explanatory legend. The (X,Y) coordinate for this legend specifies the bottom center of the legend. |
C:
    #include <ncarg/ncargC.h>
    void c_wmlgnd(float x, float y, int ntype, int irows, int icols)
where the parameters are analogous to the Fortran ones.
The internal parameters that apply to the appearance of legends are COL for specifying color and those parameters that apply to the appearance of weather fronts. See the section PLOTTING FRONT LINES for details on the internal parameters that apply to weather fronts. For examples of weather map legends, see Figures 13 and 14 in Appendix A.
CALL WMBARB(X,Y,DX,DY)
and the C entry is:
    #include <ncarg/ncargC.h>
    void c_wmbarb(float x, float y, float dx, float dy)
For the purposes of explaining the arguments in the above calls, the end of a wind barb where the barbs are drawn will be called the feather end of the barb, and the opposite end will be called the tip. Using this terminology, the tip of a wind barb will be at coordinate (X,Y), and the feather end will be at a point (X+s*DX,Y+s*DY), where "s" is a positive scale factor chosen by WMBARB to make the wind barb a standard length. The value of SQRT(DX**2+DY**2) determines the wind speed to use in drawing the barbs. The length of the shaft of the wind barb is controlled by the value of the internal parameter WBS. The length of the shaft has no relation to the wind speed.
For example, since by convention the feather end of a wind barb points in the direction where the wind is coming from, to draw a wind barb that indicates a wind coming from the north at 20 knots with tip at (0.,0.), you would make the call:
CALL WMBARB(0.,0.,0.,20.)
You can shift the drawing of the wind barb direction by 180
degrees by setting the control parameter WDF
to 1.
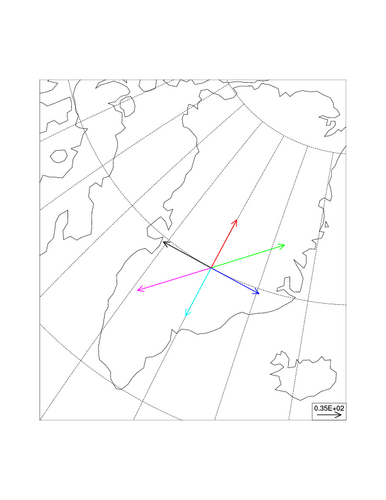
It is frequently the case that wind barbs are drawn over a world map. This can be done using WMBARB in conjunction with EZMAP, but care must be taken to adjust the direction of the wind barbs to accommodate for the map projection. For example, if your wind barb points to the north, then you will want it to point to the north pole in a map projection, rather than pointing straight up (or more accurately, it should be drawn on the map so that it is tangent to the projection of the local meridian and points northward along that meridian). See Figure 15 in Appendix A for wind barbs drawn over a map.
The internal parameters that apply to the appearance of wind barbs are: COL, BLW, EZF, WBA, WBD, WBF, WDF, WBS, WBT.
COL specifies the color of the barb; WBA specifies the angle, in degrees, that the wind barb tick marks make with the wind barb shaft; WBD specifies the spacing between tick marks along the shaft, expressed as a fraction of the shaft length; WDF is a flag controlling wind direction (=0, the default, barbs point away from wind and =1, barbs point toward wind) where barbs pointing toward the wind is the meteorological convention; WBF is a flag indicating whether space should be left at the base of a wind barb for a sky cover circle; WBS specifies the size of the wind barb shaft; WBT specifies the length of a wind barb full tick mark; BLW specifies the line width scale factor to use in drawing wind barb lines. See the table of internal parameters for details on the internal parameters that apply to wind barbs. For examples of wind barb usage, see Figures 10, 11, and 12 in Appendix A.
Fortran:
CALL WMSTNM(X,Y,IMDAT)
where X and Y are world coordinates specifying the center position of
the base of the wind barb shaft. IMDAT is a CHARACTER*5 array of
dimension 10 encoded as per the WMO/NOAA guidelines. In more detail:
| IMDAT(1)(1:1) | = | iR| - | the precipitation data indicator | IMDAT(1)(2:2) | = | iX | - | weather data and station type indicator | IMDAT(1)(3:3) | = | h | - | height above ground of base of lowest cloud | IMDAT(1)(4:5) | = | VV | - | visibility | IMDAT(2)(1:1) | = | N | - | total amount of cloud cover | IMDAT(2)(2:3) | = | dd | - | direction from which wind is blowing | IMDAT(2)(4:5) | = | ff | - | wind speed in knots
| |
| '1', | then | IMDAT(I)(2:2) | = | sn| - sign of temperature | | | IMDAT(I)(3:5) | = | TTT | - current air temperature | | | | | | | '2', | then | IMDAT(I)(2:2) | = | sn | - sign of dew point temperature | | | IMDAT(I)(3:5) | = | Td | - dew point | | | | | | | '3', | then | IMDAT(I)(2:5) | = | PO | - station pressure (not plotted) | | | | | | | '4', | then | IMDAT(I)(2:5) | = | PPPP | - pressure reduced to sea level | | | | | | | '5', | then | IMDAT(I)(2:2) | = | a | - characteristic of barograph | | | IMDAT(I)(3:5) | = | ppp | - pressure change, last 3 hrs. | | | | | | | '6', | then | IMDAT(I)(2:4) | = | RRR | - precipitation | | | IMDAT(I)(5,5) | = | tR | - time duration of precipitation | | | | | | | '7', | then | IMDAT(I)(2:3) | = | ww | - present weather | | | IMDAT(I)(4:4) | = | W1 | - most significant past weather | | | IMDAT(I)(5:5) | = | W2 | - 2nd most sig. past weather | | | | | | | '8', | then | IMDAT(I)(2:2) | = | Nh | - Fraction of sky cover | | | IMDAT(I)(3:3) | = | CL | - cloud type, low clouds | | | IMDAT(I)(4:4) | = | CM | - cloud type, medium clouds | | | IMDAT(I)(5:5) | = | CH | - cloud type, high clouds | |
    #include <ncarg/ncargC.h>
    void c_wmstnm(float x, float y, char *imdat)
where the parameters are analogous to the Fortran ones.
The internal parameters that control the appearance of wind barbs apply to the wind barbs that are part of the station model display. See the section Wind Barbs for details on wind barbs. If the specification for the wind direction, IMDAT(2)(2:3), is given as two blank characters, the plotting of the wind barb is suppressed. In addition to the wind barb parameters, the parameters WBC and WBL apply to the station model display. WBC specifies the diameter of the sky cover circle at the base of the wind barb and WBL specifies the size of the text labels in the station model display.
The internal parameter UNT specifies whether imperial units or metric units are used. The default is imperial units with the station model data being coded according to the chart "Explanation of the Daily Weather Map" provided by NOAA and published by the U.S. Government Printing Office. The coding of the metric units is in accordance with the SYNOP Data Format (FM-12) as described at:
http://weather.unisys.com/wxp/Appendices/Formats/SYNOP.html.
See the table of internal parametersfor details on the internal parameters that apply to the display of station models and wind barbs. For examples of station model displays, see Figures 11 and 12 in Appendix A.
CALL WMVECT(X,Y,U,V)
and the C entry is:
    #include <ncarg/ncargC.h>
    void c_wmvect(float x, float y, float u, float v)
The base of the vector will be at world coordinate (X,Y). The arguments u and v specify the vector components in the X and Y directions.
There are several control parameters that control the vector apperance. The parameters VRS and VRN establish the relationship between vector lengths [the value sqrt(u*u+v*v)] and the length of the vector displayed on the plot. By default a vector length of 10. gets mapped to a line that is 2% of the maximum width of the output plot. You will most likely want to change these values.
Other control parameters are:
CALL WMVECTMAP(X,Y,U,V)
and the C entry is:
    #include <ncarg/ncargC.h>
    void c_wmvectmap(float x, float y, float u, float v)
All of the control parameters mentioned above apply to vectors
drawn over maps. In this case the u argument specifies
the latitude component of the vector and v
the longitude component. The vector directions are
attenuated to accommodate for the position on the globe. For
example, if u is non-zero and v is zero, then
the vector will point toward the north pole and not necessarily
straight up as it would in a call to WMVECT.
Example wmex17 (whose source and output can be produced by executing "ncargex wmex17") illustrates these points. You can view the output from wmex17 below.
CALL WMVLBL(X,Y)
and the C entry is:
    #include <ncarg/ncargC.h>
    void c_wmvlbl(float x, float y)
The control paramaters that apply to the label box are
VLF, for setting the foreground color,
and VLB for setting the background color.
Example wmex17 (whose source and output can be produced by executing "ncargex wmex17") illustrates this. You can view the output from wmex17 below.
Fortran:
CALL WMDFLT()
C:
    #include <ncarg/ncargC.h>
    void c_wmdflt()
CALL WMSETI(CNP, IVP)
where CNP is a character string at least three characters long (whose legal values are those given in the table of internal parameters), and IVP is the integer value to be assigned to that parameter.C:
    #include <ncarg/ncargC.h>
    void c_wmseti(char *cnp, int ivp)
where the parameters are analogous to the Fortran ones.
CALL WMSETR(CNP, RVP)
where CNP is a character string at least three characters long (whose legal values are those given in the table of internal parameters), and RVP is the real value to be assigned to that parameter.C:
    #include <ncarg/ncargC.h>
    void c_wmsetr(char *cnp, float rvp)
where the parameters are analogous to the Fortran ones.
CALL WMSETC(CNP, CVP)
where CNP is a character string at least three characters long (whose legal values are those given in the table of internal parameters), and CVP is the character value to be assigned to that parameter.C:
    #include <ncarg/ncargC.h>
    void c_wmsetc(char *cnp, char *cvp)
where the parameters are analogous to the Fortran ones.
CALL WMGETI(CNP, IVP)
where CNP is a character string at least three characters long (whose legal values are those given in the table of internal parameters), and IVP is returned as the current integer value assigned to that parameter.C:
    #include <ncarg/ncargC.h>
    void c_wmgeti(char *cnp, int *ivp)
where the parameters are analogous to the Fortran ones.
CALL WMGETR(CNP, RVP)
where CNP is a character string at least three characters long (whose legal values are those given in the table of internal parameters), and RVP is returned as the real value currently assigned to that parameter.C:
    #include <ncarg/ncargC.h>
    void c_wmgetr(char *cnp, float *rvp)
where the parameters are analogous to the Fortran ones.
CALL WMGETC(CNP, CVP)
where CNP is a character string at least three characters long (whose legal values are those given in the table of internal parameters), and CVP is the character value currently assigned to that parameter. CVP should be of a length suitable to receive the string value returned.C:
    #include <ncarg/ncargC.h>
    void c_wmgetc(char *cnp, char *cvp)
where the parameters are analogous to the Fortran ones.
| Name | Type | Description | Default | |||||||||||||||||||||||||||||||||||||||||||||||||||||||||||||||||||||||||||||||||||||||||||||||||||||||||||||||||||||||||||||||||||||||||||||||||||||||||||||||||||||||||||||||||||||||||||||||||||||||||||||||||||||||||||||||||||||||||||||||||||||||||||||||
|---|---|---|---|---|---|---|---|---|---|---|---|---|---|---|---|---|---|---|---|---|---|---|---|---|---|---|---|---|---|---|---|---|---|---|---|---|---|---|---|---|---|---|---|---|---|---|---|---|---|---|---|---|---|---|---|---|---|---|---|---|---|---|---|---|---|---|---|---|---|---|---|---|---|---|---|---|---|---|---|---|---|---|---|---|---|---|---|---|---|---|---|---|---|---|---|---|---|---|---|---|---|---|---|---|---|---|---|---|---|---|---|---|---|---|---|---|---|---|---|---|---|---|---|---|---|---|---|---|---|---|---|---|---|---|---|---|---|---|---|---|---|---|---|---|---|---|---|---|---|---|---|---|---|---|---|---|---|---|---|---|---|---|---|---|---|---|---|---|---|---|---|---|---|---|---|---|---|---|---|---|---|---|---|---|---|---|---|---|---|---|---|---|---|---|---|---|---|---|---|---|---|---|---|---|---|---|---|---|---|---|---|---|---|---|---|---|---|---|---|---|---|---|---|---|---|---|---|---|---|---|---|---|---|---|---|---|---|---|---|---|---|---|---|---|---|---|---|---|---|---|---|---|---|---|---|---|---|---|
| ALO | integer | Flag to indicate whether a weather front is at the surface or aloft (ALO=0 is surface; ALO=1 is aloft). | 0 | |||||||||||||||||||||||||||||||||||||||||||||||||||||||||||||||||||||||||||||||||||||||||||||||||||||||||||||||||||||||||||||||||||||||||||||||||||||||||||||||||||||||||||||||||||||||||||||||||||||||||||||||||||||||||||||||||||||||||||||||||||||||||||||||
| AOC | integer | Color index for the outlines of arrows (outlines drawn only if AOC is non-negative). | -1 | |||||||||||||||||||||||||||||||||||||||||||||||||||||||||||||||||||||||||||||||||||||||||||||||||||||||||||||||||||||||||||||||||||||||||||||||||||||||||||||||||||||||||||||||||||||||||||||||||||||||||||||||||||||||||||||||||||||||||||||||||||||||||||||||
| ARC | float | Length of current front line (retrieval only) | 0. | |||||||||||||||||||||||||||||||||||||||||||||||||||||||||||||||||||||||||||||||||||||||||||||||||||||||||||||||||||||||||||||||||||||||||||||||||||||||||||||||||||||||||||||||||||||||||||||||||||||||||||||||||||||||||||||||||||||||||||||||||||||||||||||||
| ARD | float | Direction of arrows, expressed in degrees. | 0. | |||||||||||||||||||||||||||||||||||||||||||||||||||||||||||||||||||||||||||||||||||||||||||||||||||||||||||||||||||||||||||||||||||||||||||||||||||||||||||||||||||||||||||||||||||||||||||||||||||||||||||||||||||||||||||||||||||||||||||||||||||||||||||||||
| ARL | float | Scale factor for the length of an arrow's tail, independent of the arrow's size. This is to say that the tail is elongated, but the arrow is not made fatter or otherwise increased in size. | 1. | |||||||||||||||||||||||||||||||||||||||||||||||||||||||||||||||||||||||||||||||||||||||||||||||||||||||||||||||||||||||||||||||||||||||||||||||||||||||||||||||||||||||||||||||||||||||||||||||||||||||||||||||||||||||||||||||||||||||||||||||||||||||||||||||
| ARS | float | Size of arrows, expressed as a fraction of the maximum screen height. | 0.035 | |||||||||||||||||||||||||||||||||||||||||||||||||||||||||||||||||||||||||||||||||||||||||||||||||||||||||||||||||||||||||||||||||||||||||||||||||||||||||||||||||||||||||||||||||||||||||||||||||||||||||||||||||||||||||||||||||||||||||||||||||||||||||||||||
| ASC | integer | Color index for the shadows of arrows (shadows are drawn only if ASC is non-negative). | -1 | |||||||||||||||||||||||||||||||||||||||||||||||||||||||||||||||||||||||||||||||||||||||||||||||||||||||||||||||||||||||||||||||||||||||||||||||||||||||||||||||||||||||||||||||||||||||||||||||||||||||||||||||||||||||||||||||||||||||||||||||||||||||||||||||
| AWC | integer | Color index for the interior of arrows. | 1 | |||||||||||||||||||||||||||||||||||||||||||||||||||||||||||||||||||||||||||||||||||||||||||||||||||||||||||||||||||||||||||||||||||||||||||||||||||||||||||||||||||||||||||||||||||||||||||||||||||||||||||||||||||||||||||||||||||||||||||||||||||||||||||||||
| BEG | float | Space, expressed as a fraction of the maximum screen width, to leave along a front line before the first symbol is drawn. | 0.015 | |||||||||||||||||||||||||||||||||||||||||||||||||||||||||||||||||||||||||||||||||||||||||||||||||||||||||||||||||||||||||||||||||||||||||||||||||||||||||||||||||||||||||||||||||||||||||||||||||||||||||||||||||||||||||||||||||||||||||||||||||||||||||||||||
| BET | float | Space, expressed as a fraction of the maximum screen width, to leave between symbols along a front line. | 0.045 | |||||||||||||||||||||||||||||||||||||||||||||||||||||||||||||||||||||||||||||||||||||||||||||||||||||||||||||||||||||||||||||||||||||||||||||||||||||||||||||||||||||||||||||||||||||||||||||||||||||||||||||||||||||||||||||||||||||||||||||||||||||||||||||||
| BLW | float | Sets the line width used for drawing wind barbs. | 1.0 | |||||||||||||||||||||||||||||||||||||||||||||||||||||||||||||||||||||||||||||||||||||||||||||||||||||||||||||||||||||||||||||||||||||||||||||||||||||||||||||||||||||||||||||||||||||||||||||||||||||||||||||||||||||||||||||||||||||||||||||||||||||||||||||||
| CBC | integer | The color index to be used for backgrounds of city and daily high/low labels. | 1 | |||||||||||||||||||||||||||||||||||||||||||||||||||||||||||||||||||||||||||||||||||||||||||||||||||||||||||||||||||||||||||||||||||||||||||||||||||||||||||||||||||||||||||||||||||||||||||||||||||||||||||||||||||||||||||||||||||||||||||||||||||||||||||||||
| CC1 | integer | Color index for the interior of a cloud symbol. | 2 | |||||||||||||||||||||||||||||||||||||||||||||||||||||||||||||||||||||||||||||||||||||||||||||||||||||||||||||||||||||||||||||||||||||||||||||||||||||||||||||||||||||||||||||||||||||||||||||||||||||||||||||||||||||||||||||||||||||||||||||||||||||||||||||||
| CC2 | integer | Color index for the outline of the cloud symbol. | 1 | |||||||||||||||||||||||||||||||||||||||||||||||||||||||||||||||||||||||||||||||||||||||||||||||||||||||||||||||||||||||||||||||||||||||||||||||||||||||||||||||||||||||||||||||||||||||||||||||||||||||||||||||||||||||||||||||||||||||||||||||||||||||||||||||
| CC3 | integer | Color index for the shadow of the cloud symbol. | 1 | |||||||||||||||||||||||||||||||||||||||||||||||||||||||||||||||||||||||||||||||||||||||||||||||||||||||||||||||||||||||||||||||||||||||||||||||||||||||||||||||||||||||||||||||||||||||||||||||||||||||||||||||||||||||||||||||||||||||||||||||||||||||||||||||
| CFC | integer | Color index to use for cold front symbols. | 1 | |||||||||||||||||||||||||||||||||||||||||||||||||||||||||||||||||||||||||||||||||||||||||||||||||||||||||||||||||||||||||||||||||||||||||||||||||||||||||||||||||||||||||||||||||||||||||||||||||||||||||||||||||||||||||||||||||||||||||||||||||||||||||||||||
| CHT | float | Height of characters, expressed as a fraction of the maximum screen width, of the city labels and daily high/low temperatures. | 0.0105 | |||||||||||||||||||||||||||||||||||||||||||||||||||||||||||||||||||||||||||||||||||||||||||||||||||||||||||||||||||||||||||||||||||||||||||||||||||||||||||||||||||||||||||||||||||||||||||||||||||||||||||||||||||||||||||||||||||||||||||||||||||||||||||||||
| CMG | float | Size, expressed as a fraction of the maximum screen height, of the margins used for the city labels. | 0.002 | |||||||||||||||||||||||||||||||||||||||||||||||||||||||||||||||||||||||||||||||||||||||||||||||||||||||||||||||||||||||||||||||||||||||||||||||||||||||||||||||||||||||||||||||||||||||||||||||||||||||||||||||||||||||||||||||||||||||||||||||||||||||||||||||
| COL | integer | Color index to use for all objects that require only a single color setting. | 1 | |||||||||||||||||||||||||||||||||||||||||||||||||||||||||||||||||||||||||||||||||||||||||||||||||||||||||||||||||||||||||||||||||||||||||||||||||||||||||||||||||||||||||||||||||||||||||||||||||||||||||||||||||||||||||||||||||||||||||||||||||||||||||||||||
| CS1 | float | Slope of the left edge of a front line as calculated internally as measured in degrees from the X-axis (used when SLF=0,2, or 3). This parameter is for retrieval only. | N/A | |||||||||||||||||||||||||||||||||||||||||||||||||||||||||||||||||||||||||||||||||||||||||||||||||||||||||||||||||||||||||||||||||||||||||||||||||||||||||||||||||||||||||||||||||||||||||||||||||||||||||||||||||||||||||||||||||||||||||||||||||||||||||||||||
| CS2 | float | Slope of the right edge of a front line as calculated internally as measured in degrees from the X-axis (used when SLF=0,1, or 3). This parameter is for retrieval only. | N/A | |||||||||||||||||||||||||||||||||||||||||||||||||||||||||||||||||||||||||||||||||||||||||||||||||||||||||||||||||||||||||||||||||||||||||||||||||||||||||||||||||||||||||||||||||||||||||||||||||||||||||||||||||||||||||||||||||||||||||||||||||||||||||||||||
| DBC | integer | The color index to be used for the background shadow for the dots marking the city locations. | 0 | |||||||||||||||||||||||||||||||||||||||||||||||||||||||||||||||||||||||||||||||||||||||||||||||||||||||||||||||||||||||||||||||||||||||||||||||||||||||||||||||||||||||||||||||||||||||||||||||||||||||||||||||||||||||||||||||||||||||||||||||||||||||||||||||
| DTC | integer | The color index to use for the dots marking the city locations. | 1 | |||||||||||||||||||||||||||||||||||||||||||||||||||||||||||||||||||||||||||||||||||||||||||||||||||||||||||||||||||||||||||||||||||||||||||||||||||||||||||||||||||||||||||||||||||||||||||||||||||||||||||||||||||||||||||||||||||||||||||||||||||||||||||||||
| DTS | float | Size, expressed as a fraction of the maximum screen height, of the dots used to mark cities. | 0.006 | |||||||||||||||||||||||||||||||||||||||||||||||||||||||||||||||||||||||||||||||||||||||||||||||||||||||||||||||||||||||||||||||||||||||||||||||||||||||||||||||||||||||||||||||||||||||||||||||||||||||||||||||||||||||||||||||||||||||||||||||||||||||||||||||
| DWD | float | Line widths for front lines that do not have symbols along them (like tropical fronts and convergence lines). | 2.0 | |||||||||||||||||||||||||||||||||||||||||||||||||||||||||||||||||||||||||||||||||||||||||||||||||||||||||||||||||||||||||||||||||||||||||||||||||||||||||||||||||||||||||||||||||||||||||||||||||||||||||||||||||||||||||||||||||||||||||||||||||||||||||||||||
| END | float | Space, expressed as a fraction of the maximum screen width, to leave along a front line after the last symbol has been drawn. | 0.015 | |||||||||||||||||||||||||||||||||||||||||||||||||||||||||||||||||||||||||||||||||||||||||||||||||||||||||||||||||||||||||||||||||||||||||||||||||||||||||||||||||||||||||||||||||||||||||||||||||||||||||||||||||||||||||||||||||||||||||||||||||||||||||||||||
| EZF | integer | A flag to be used only in NCL codes that, when set different from -1, indicates wmap functions are to be used with the NCL mapping functions. | -1 | |||||||||||||||||||||||||||||||||||||||||||||||||||||||||||||||||||||||||||||||||||||||||||||||||||||||||||||||||||||||||||||||||||||||||||||||||||||||||||||||||||||||||||||||||||||||||||||||||||||||||||||||||||||||||||||||||||||||||||||||||||||||||||||||
| FRO | string | Front type (one of 'WARM', 'COLD', 'OCCLUDED', 'STATIONARY', 'SQUALL', 'TROPICAL', or 'CONVERGENCE'). | 'WARM' | |||||||||||||||||||||||||||||||||||||||||||||||||||||||||||||||||||||||||||||||||||||||||||||||||||||||||||||||||||||||||||||||||||||||||||||||||||||||||||||||||||||||||||||||||||||||||||||||||||||||||||||||||||||||||||||||||||||||||||||||||||||||||||||||
| HIB | integer | Background color index for the "H" drawn for the high pressure symbols. | 0 | |||||||||||||||||||||||||||||||||||||||||||||||||||||||||||||||||||||||||||||||||||||||||||||||||||||||||||||||||||||||||||||||||||||||||||||||||||||||||||||||||||||||||||||||||||||||||||||||||||||||||||||||||||||||||||||||||||||||||||||||||||||||||||||||
| HIC | integer | Color index of the circumscribed circle for the "H" drawn for the high pressure symbols. | 1 | |||||||||||||||||||||||||||||||||||||||||||||||||||||||||||||||||||||||||||||||||||||||||||||||||||||||||||||||||||||||||||||||||||||||||||||||||||||||||||||||||||||||||||||||||||||||||||||||||||||||||||||||||||||||||||||||||||||||||||||||||||||||||||||||
| HIF | integer | Color index for the "H" drawn for the high pressure symbols. | 1 | |||||||||||||||||||||||||||||||||||||||||||||||||||||||||||||||||||||||||||||||||||||||||||||||||||||||||||||||||||||||||||||||||||||||||||||||||||||||||||||||||||||||||||||||||||||||||||||||||||||||||||||||||||||||||||||||||||||||||||||||||||||||||||||||
| HIS | integer | Color index for the shadow of the high pressure symbols | 1 | |||||||||||||||||||||||||||||||||||||||||||||||||||||||||||||||||||||||||||||||||||||||||||||||||||||||||||||||||||||||||||||||||||||||||||||||||||||||||||||||||||||||||||||||||||||||||||||||||||||||||||||||||||||||||||||||||||||||||||||||||||||||||||||||
| LC1 | integer | Color index for the interior of the lightning bolt symbol
| LC2
| integer
| Color index for the outline of the lightning bolt symbol.
| 1
| LC3
| integer
| Color index for the shadow of the lightning bolt symbol
| 1
| LIN
| float
| Line widths, expressed as a fraction of the maximum screen width, for fronts having symbols along them.
| 8.
| LOB
| integer
| Color index for the
background of the "L" drawn for the low pressure symbols.
| 1
| LOC
| integer
| Color index for the circumscribed circle
for the "L" drawn for the low pressure symbols.
| 1
| LOF
| integer
| Color index for the "L" drawn for the low pressure symbols.
| 0
| LOS
| integer
| Color index for the shadow of the low pressure symbols.
| 0
| LWD
| float
| Line width used when parameter WTY=1 (see below)
| 0.00275
| MXS
| integer
| Maximum number of symbols allowed along a weather front line.
| 200
| NBZ
| integer
| The number of points to use in the Bezier curves for the symbols along the warm fronts.
| 51
| NMS
| integer
| Specifies precisely the number of symbols to appear along a weather front line (if this parameter has not been set by the user, then it is calculated internally).
| -1
| OER
| integer
| Specifies an observational error bound for smoothing spline
calculations for drawing front lines. The default is 0.005
times the absolute value of the maximum data value. Only applies
when SMF flags smooting spline usage.
| depends
| PAI
| integer
| Current parameter array index used in specifying internal parameters that are arrays.
| 1
| RBS
| integer
| The color index to use for the background of the regional temperature labels (plotted only if RBS is non-negative).
| -1
| RC1
| integer
| Color index for the outline of the boxes drawn for the regional weather labels.
| 1
| RC2
| integer
| Color index for the backgrounds of the boxes used for the regional weather labels.
| 0
| RC3
| integer
| Color index for the shadow color of the boxes used for the regional weather labels.
| 1
| RC4
| integer
| Color index for the text string used for regional weather labels.
| 1
| RC5
| integer
| Color for the outlines of the characters in the text strings used for regional weather labels (plotted only if RC5 is non-negative).
| -1
| REV
| integer
| Reverses the current setting
that the direction symbols will be drawn along front lines. REV must be
set after FRO.
| N/A
| RFC
| integer
| The color index to be used for the foreground of regional temperature labels and cities.
| 1
| RHT
| float
| Height, expressed as a fraction of the maximum screen width, of the characters used for the regional weather patterns (like rain, snow, etc.).
| 0.008
| RLS
| integer
| The color index to use for shadows of regional temperature labels.
| 1
| RMG
| float
| Size, expressed as a fraction of the maximum screen height, of the margins of the regional temperature labels.
| 0.001
| ROS
| integer
| The color index to use for the outlines of the regional temperature labels (plotted only if ROS is non-negative).
| -1
| SC1
| integer
| Color index to be used for the center of the sun symbol.
| 2
| SC2
| integer
| Color index for the points of the sun symbol.
| 3
| SC3
| integer
| Color index for the outline of the sun symbol.
| 1
| SC4
| integer
| Color index for the shadow of the sun symbol.
| 1
| SHT
| float
| Height of symbols, expressed as a fraction of the maximum screen width, for all the special symbols.
| 0.02
| SIG
| float
| Specifies the tension factor for tension spline calculations
for drawing front lines. Small values (~0.001) produce near
cubic spline interpolation; larger values (~20.) produce near
linear interpolation.
| 0.001
| SL1
| float
| The slope of the beginning of a front line measured in degrees from the X-axis. This parameter is used in conjunction with the parameter SLF.
| 0.0
| SL2
| float
| The slope of the end of a front line measured in degrees from the X-axis. This parameter is used in conjunction with the parameter SLF.
| 0.0
| SLF
| integer
| Flag for indicating how the slopes at the end of a front line should be handled (0=use SL1 & SL2; 1=use SL1 only; 2=use SL2 only; 3=use neither SL1 or SL2). When either SL1 or SL2 is not used, it is calculated internally.
| 3
| SMF
| integer
| Specifies whether tension spline interpolation (=0) or smoothing
spline approximation (=1) is done to draw front lines.
| 0
| SMT
| float
| Specifies a degree of smoothing for smoothing spline approximations
when drawing a front line. The default is 50 x the number of
input data points.
| depends
| STY
| integer
| An array for precisely specifying whether a warm front or cold front symbol is to be drawn at the specified position along a front line (1=cold; 2=warm). Use the internal parameter PAI for defining this array.
| all 2s
| SWI
| float
| Width of a symbol along a weather front, expressed as a fraction of the maximum screen width.
| 0.0325
| T1C
| integer
| One color to use for the alternating colors of the dashes in the tropical fronts.
| 1
| T2C
| integer
| A second color to use for the alternating colors of the dashes in the tropical fronts.
| 1
| THT
| float
| Height of characters, expressed as a fraction of the maximum screen width, for the regional temperature labels.
| 0.0165
| UNT
| integer
| Flags whether to use imperial units (the default) or metric units in a station model display.
| 0
| VCC
| integer
| Color index for vector color.
| 1
| VCD
| float
| Vector direction in degrees, 0. points up, progressing clockwise.
| 0.
| VCH
| float
| Size, in NDC coordinates, of the length of a vector arrow head.
| 0.02
| VCW
| float
| Linewidth scale factor for vector lines.
| 1.
| VLB
| integer
| Color index for vector label background.
| 1
| VLF
| integer
| Color index for vector label foreground.
| 1
| VRS
| float
| Size of the vector that will be scaled
to the NDC length specified by
VRN.
| 10.
| VRN
| float
| Size, in NDC coordinates, that a vector of length
specified by VRS is to scale to.
| 0.02
| VVA
| float
| The angle, in degrees, that a vector arrow head makes with the tail.
| 25.
| VVC
| integer
| Flags whether the surface visibility in station model displays is
plotted as the raw two-character SYNOP codes. Default is no, 1 is
yes.
| 0
| WBA
| float
| Angle (in degrees) that the wind barb tics make with the wind barb shafts.
| 62.
| WBC
| float
| Diameter of sky cover circle at base of wind barb, expressed as a fraction of the shaft length.
| 0.3
| WBD
| float
| Spacing between tick marks along a wind barb expressed as a fraction of the wind barb shaft length.
| 0.1
| WBF
| integer
| Flag indicating whether the base of a wind barb should be drawn to allow for the sky cover circle at its base (WBF=1 means yes; WBF=0 means no).
| 0
| WDF
| integer
| Flag indicating orientation of the wind barb (=0 barbs point away from wind direction; =1 barbs point toward wind direction). A value of 1 is the meteorological convention.
| 0
| WBL
| float
| Size of the text labels in the station model display, expressed as a fraction of the shaft length.
| 0.17
| WBR
| float
| Radius of the larger circle drawn for calm, as a fraction of the wind barb shaft length.
| 0.25
| WBS
| float
| The size, expressed as a fraction of the maximum screen height, of a wind barb shaft.
| 0.035
| WBT
| float
| Length of wind barb full tick as a fraction of its shaft length.
| 0.33
| WFC
| integer
| Color index to use for warm front symbols.
| 1
| WHT
| float
| Height of characters, expressed as a fraction of the maximum screen width, of the characters used for regional weather labels (plotted with WMLABW or c_wmlabw).
| 0.014
| WTY
| integer
| Flag indicating whether linewidths are to be implemented via GKS (WTY=0), or simulated internally (WTY=1).
| 0
| |
By default, SETER prints a line and STOPs. The line printed will look something like this:
ERROR    2 IN WMDRFT - not enough space along the
input curve to draw two symbols for a stationary front
The error number ("2", in the example) may be of use to a consultant (to determine exactly where the error occurred), but is not otherwise meaningful. The actual error message consists of the name of the routine in which the error occurred ("WMDRFT", in the example), a blank, a minus sign, another blank, and, lastly, a short description of the error.
All errors are "recoverable" in the sense that, if the user program puts SETER into "recovery mode", control will be returned to the caller of the WMAP routine in which the error occurred. In some cases, it is then possible to take remedial action to get around whatever problem has occurred; in any case, the error flag can be cleared and execution of the user's program can continue.
Figure 1 - ncargex example wmex01
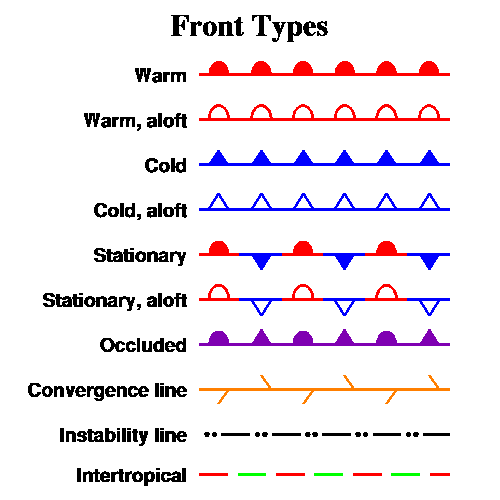
Figure 2 - ncargex example wmex02
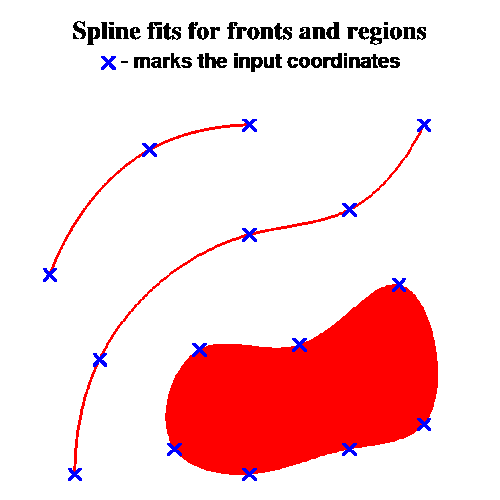
Figure 3 - ncargex example wmex03
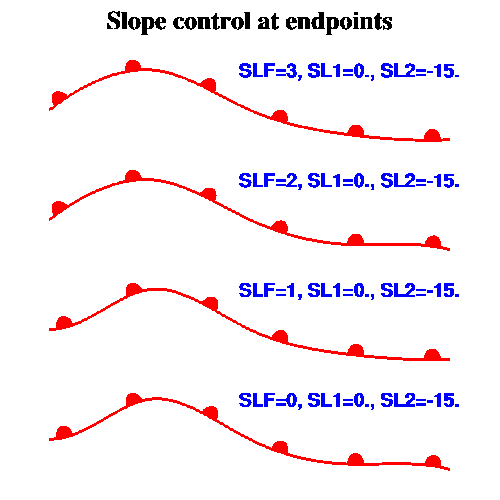
Figure 4 - ncargex example wmex04
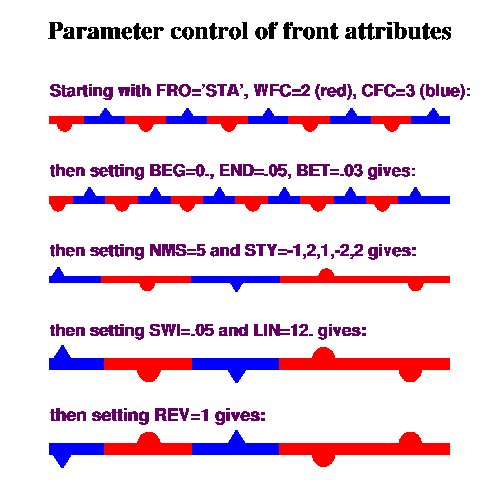
Figure 5 - ncargex example wmex05
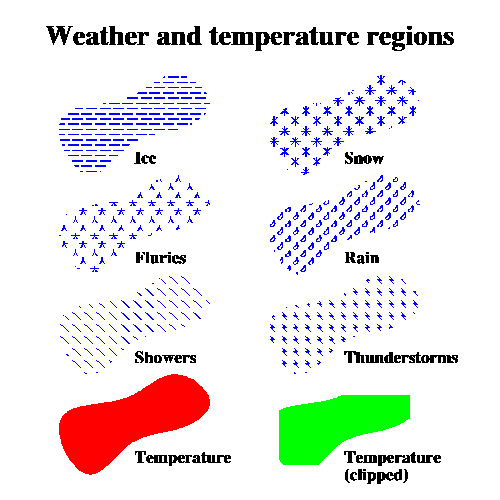
Figure 6 - ncargex example wmex06

Figure 7 - ncargex example wmex07
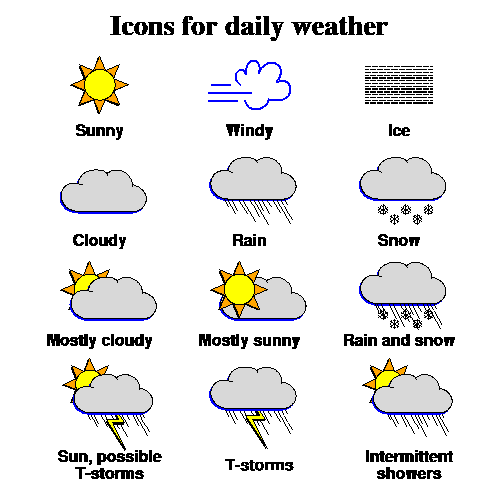
Figure 8 - ncargex example wmex08

Figure 9 -ncargex example wmex09

Figure 10 - ncargex example wmex10
Figure 11 - ncargex example wmex11
Figure 12 - ncargex example wmex12
Figure 13 - ncargex example wmex13
Figure 14 - ncargex example wmex14
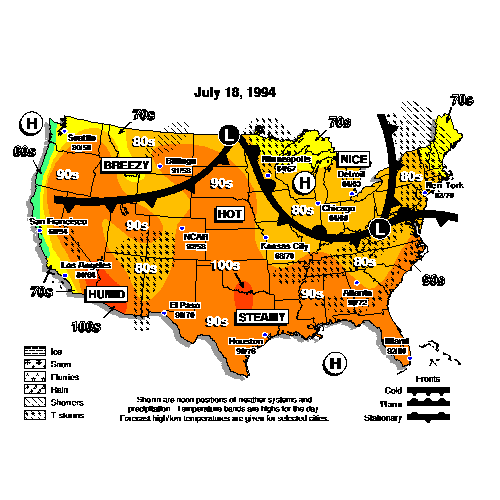
Figure 15 - ncargex example wmex15
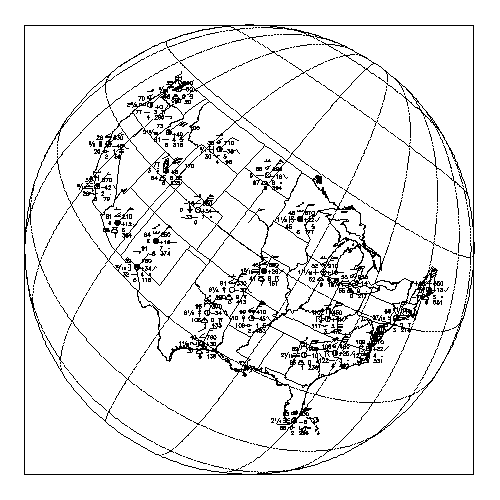
Figure 16 - ncargex example wmex16
Figure 17 - ncargex example wmex17